EURUSD Daily Analysis
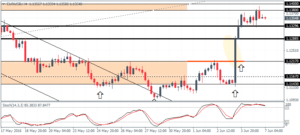
EURUSD (1.135): EURUSD closed with a doji yesterday and a bearish follow through today could see prices starting to pull lower. Price tested the resistance levels of 1.14 – 1.1380 yesterday. We currently see a strong hidden bearish divergence in EURUSD with the current lower highs in prices. Correction in the EURUSD could see prices test previous major support at 1.12170. The EURUSD bias remains sideways for the moment.
USDJPY Daily Analysis
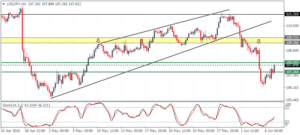
USDJPY (107.8): USDJPY was bullish yesterday, but price action is yet to signal the shift to the upside. A daily close above 108 is essential in order to expect more upside in USDJPY. There is also a bullish divergence showing on the daily charts but needs to be confirmed only when prices can close above 108. On the 4-hour chart, the strong pullback seen since yesterday comes with the risk of prices breaking down lower with the hidden divergence in play. Above 108, USDJPY could move into a sideways range below 109.35.
GBPUSD Daily Analysis
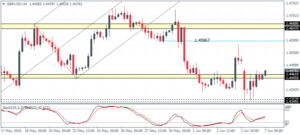
GBPUSD (1.447): GBPUSD was trading weaker yesterday, but prices managed to hold above 1.44250 support. However, the multiple tests of support near 1.4358 – 1.435 resulted in prices being rejected strongly and was followed by a move above the near term support/resistance at 1.4461 – 1.4445. Further upside could be seen to fill yesterday’s gap near 1.4517. Establishing support at 1.4461 could see prices consolidate within 1.4647 – 1.44610.
Gold Daily Analysis
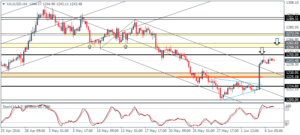
XAUUSD (1243): Gold prices closed in a doji yesterday following Friday’s strong bullish run. The lower time frame chart shows a bearish divergence occurring which could pull prices lower to correct near the 1230 – 1225 broken resistance level which could be tested for support. To the upside, the correction should see a move towards 1250 followed by a test of resistance at 1262 – 1258 level. The correction to 1230 – 1225 is also seen on the H4 with the hidden divergence as prices make a lower high on the higher high in Stochastics.
