EURUSD Daily Analysis
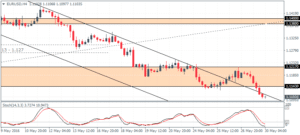
EURUSD (1.110): EURUSD has posted a steady decline for the past four weekly sessions, closing Friday at 1.1112. On the 4-hour chart, EURUSD is likely to post a retracement with the current lows in price not confirmed by the Stochastics oscillator. Price action needs to close above 1.1143, in order to validate a retracement which could see a correction to 1.138, which is pending for a retest of resistance confirmation. To the downside, continued momentum could see EURUSD fall further towards 1.110 support.
USDJPY Daily Analysis
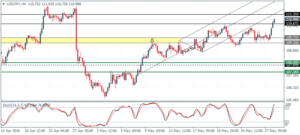
USDJPY (110.9): USDJPY was bullish on Friday closing at 110.34, but price action closed a few pips above the 50 period EMA. The ranging price action is likely to continue with a risk of a brief test to 111.0 resistance. The 4-hour chart shows USDJPY caught within the range of 110.31 – 110.672 resistance and 109.35 support. Further upside is likely only on a break above 111.31 resistance high, while to the downside, 108 support will be tested if the current support at 109.35 breaks.
GBPUSD Daily Analysis
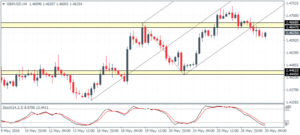
GBPUSD (1.462): GBPUSD closed bearish on Friday following a brief test to 1.4743. Support at 1.4425 remains a likely level for GBPUSD to test but the downside is limited from the current levels. The 4-hour chart shows price trading below 1.4668 – 1.4647. Any rallies are likely to be capped near this resistance, which could see an eventual decline towards lower support at 1.4461 – 1.44450.
Gold Daily Analysis
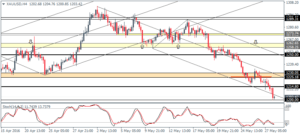
XAUUSD (1203): Gold prices cleared the 1230 support on Friday and closed the 4-hour session in a hammer pattern. Prices slipped down to 1203 in early trading today with the psychological barrier seen at 1200, likely to hold the declines. Resistance at 1230 – 1225 will be the initial level that could cap the rallies, but a break above this level could see a move back to 1250 and eventually to 1262 – 1258 main support level that was broken and which could now be tested for resistance.
