EURUSD Daily Analysis
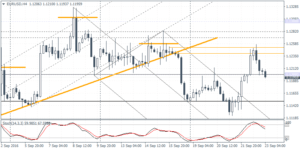
EURUSD (1.1195): EURUSD’s failure to close above 1.1200 resistance yesterday keeps prices flat for the most part with the range of 1.1100 likely to remain in play. However, the reversal near 1.1251 yesterday marks a retest of the breakout from the neckline level of the head and shoulders pattern that was formed. This could indicate further declines on a convincing close below 1.1200. A retest to 1.1100 remains very much a possibility, but any declines below that will need to be convincing to ascertain the case for a dip to 1.1000. To the upside, any reversal off 1.1200 could spell further strength in the single currency which could aim for a retest to 1.1270 – 1.1281 resistance.
USDJPY Daily Analysis
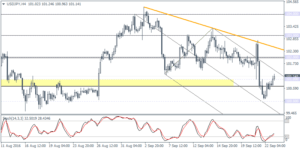
USDJPY (101.14): USDJPY is seen posting a reversal after a dip to the 100.00 psychological level. Price action is seen heading towards 102.00 in the near term, but there are no distinctive signs that further upside could be maintained. On the daily chart, the support at 100.00 has been tested twice within the descending triangle pattern. Failure to breakout above 102.00 to extend the gains could signal further weakness in USDJPY with the potential to break down below the 100.00 handle.
GBPUSD Daily Analysis
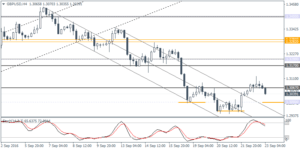
GBPUSD (1.3039): GBPUSD, failing to capitalize on the gains from the FOMC is seen trending lower today with a retest back to 1.3000 quite possible. On the 4-hour chart time frame, there is scope for an inverse head and shoulders pattern that could be forming with the left shoulder and the head formed already. A higher low around 1.3000 region could send an initial signal of a reversal that could take place. A breakout rally to the neckline resistance at 1.3067 could validate the inverse head and shoulders pattern that could send GBPUSD towards 1.3200 – 1.3170 resistance level. To the downside, a breakdown below 1.3000 could see further weakness in the cable with the potential for price to fall back to the previous lows at 1.2950.
Gold Daily Analysis
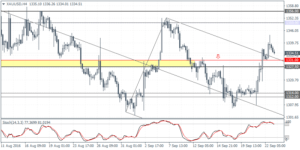
XAUUSD (1334.51): Gold prices closed in a doji yesterday above the support at 1331 – 1327.50. Depending on how today’s price action unfolds, we could expect some near-term correction to prices. On the 4-hour chart, support at 1331 – 1327.50 will no doubt offer a short-term bounce, but further weakness can be expected if the support gives way. Gold prices could be seen falling back to the previous support at 1314 – 1312 region.
