EURUSD Daily Analysis
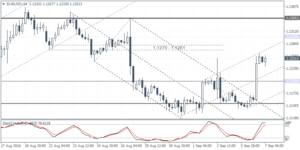
EURUSD (1.1251): EURUSD closed above 1.1200 yesterday with price action now likely to stay flat within 1.1300 – 1.1270 price level into tomorrow’s ECB meeting. In the near term, expect the price to dip towards 1.1200 on the minor bearish divergence that is formed on the chart. Resistance at 1.1270 – 1.1280 remains key to the upside, and a break out above this resistance could keep the bullish momentum send EURUSD to test 1.1300 followed by 1.1341. A possible reversal near the resistance level could, however, signal a near-term weakness, which could be confirmed if EURUSD breaks down below 1.1200.
USDJPY Daily Analysis
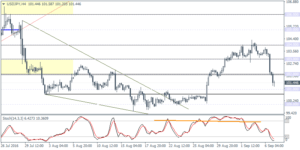
USDJPY (101.44): USDJPY is back near the 102.00 support level with prices seen trading below the support. The support zone near 102.00 – 100.80 remains a key level of interest and the retest to this support level has been long coming. Watch for price reversal near 101.00 – 100.80 as the Stochastics is likely to form a lower low indicating a hidden bullish divergence. This could potentially make way for USDJPY to renew its uptrend with 104.00 coming in as the initial resistance followed by 106.00. A break below 100.60 could, however, signal further weakness of a sideways range that could be established.
GBPUSD Daily Analysis
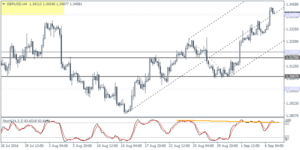
GBPUSD (1.3401): GBPUSD edged higher towards 1.3400 yesterday, testing the resistance level that was established around late June and then briefly tested in July. The daily chart shows the potential support at 1.3200 that needs to be tested in order to validate further upside gains. On the 4-hour chart, there is no evidence of a lower high but the bearish divergence indicates a correction that is impending towards 1.3200 – 1.3170.
Gold Daily Analysis
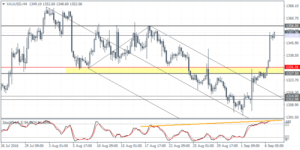
XAUUSD (1352.06): Gold prices rallied back to the 1350 handle yesterday, but the bullish price action is clearly not out of the woods. Resistance near 1350 – 1360 remains strong which could keep prices capped to the upside. On the 4-hour chart, mark the hidden bearish divergence as the Stochastics has formed a higher high against the lower high in price. As long as 1356 is not breached, gold prices could be looking to correct lower towards 1330.00 followed by 1314.00.
