EURUSD Daily Analysis
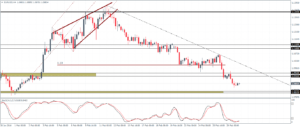
EURUSD (1.08): EURUSD has closed below 1.093 level of support which could signal a continued decline lower. Price action could, however, attempt a modest pullback to test the recently broken support level back to 1.095 – 1.093 with a test of lower support at 1.0835 – 1.0825 to the downside. With prices trending lower and below the falling trend line, the decline in the lower support will be key. A break below 1.0825 could signal a move lower with the next key support at 1.07 levels. To the upside, above 1.095, EURUSD could attempt a move towards 1.1105 – 1.113 resistance, which is pending to be retested following a break of support.
USDJPY Daily Analysis
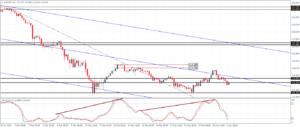
USDJPY (112.5): USDJPY closed bearish yesterday but prices are currently supported above the 112 support level. However, a decline lower is likely following the Stochastics oscillator which is likely to show another leg lower. 111 – 111.31 support will be key to the downside following a test of resistance near 113 – 112.5 levels as the hidden bearish divergence remains in play. A move to 111 – 111.31 could possibly pave the way for an eventual upside correction to 117 on a break above 113.
GBPUSD Daily Analysis
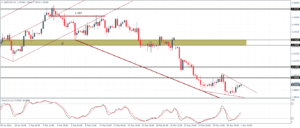
GBPUSD (1.393): GBPUSD managed to bounce off the dynamic support from the lower median line on the daily chart. A continuation to the upside could see GBPUSD attempt to retest the 1.42 broken support for resistance which is likely only on a daily close above 1.40. On the 4-hour chart, there is a likelihood for prices to consolidate into a descending triangle pattern, which is validated could see the move to the upside, above 1.40. Alternatively, below 1.383, a dip to 1.38 is likely if the bearish momentum takes over again.
Gold Daily Analysis
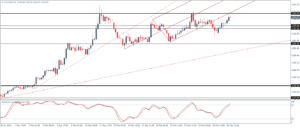
XAUUSD (1243): Gold prices continue to consolidate below the previous highs of 1260 and the 1200 support level with yesterday’s price action forming a bullish engulfing pattern. A retest to the previous higher close at 1246 could potentially pave the way for a breakout higher while if the price holds the rally, Gold could decline lower. There is also a bullish ascending triangle in place currently, validating the breakout to the upside. Only a close below 1190 – 1200 will confirm a move to the downside.
