EURUSD Daily Pivots
| R3 | 1.1591 |
| R2 | 1.152 |
| R1 | 1.1464 |
| Pivot | 1.1393 |
| S1 | 1.1337 |
| S2 | 1.1265 |
| S3 | 1.1211 |
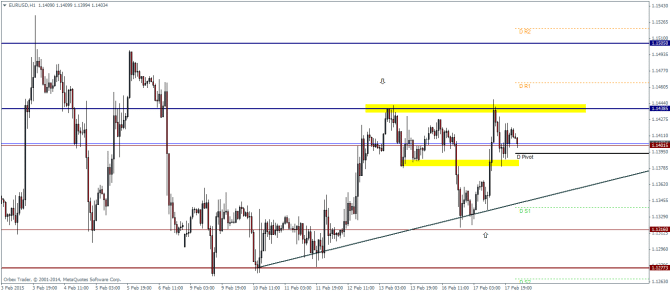
EURUSD has been ranging within a wider band for the past few days within the range of 1.148 and 1.12845. A break out from this consolidation is likely with the potential of an upside breakout targeting 1.16 while a downside break out could target 1.1164.
Within the smaller time frames, we notice price respecting the trend line and trading above the short term support level at 1.138 and 1.137 levels and also potentially forming an inverted head and shoulders pattern. A break out from 1.14385 could be an early indication of a move to the upside, while a break down from the rising trend line could pave way for a test to the lower end of the range at 1.12845 and eventually down to 1.16.
USDJPY Daily Pivots
| R3 | 120.87 |
| R2 | 120.141 |
| R1 | 119.696 |
| Pivot | 118.964 |
| S1 | 118.51 |
| S2 | 117.778 |
| S3 | 117.333 |
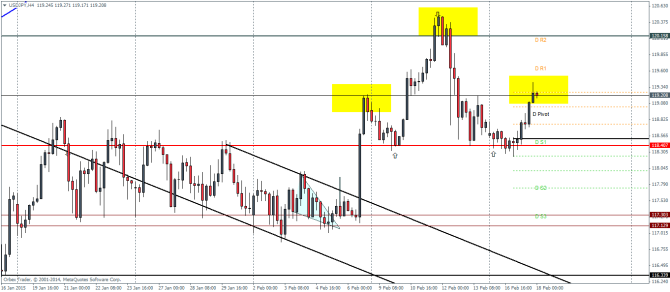
USDJPY has bounced off the “neckline” at 118.4 to form the right shoulder which peaked at 119 levels. If price action holds the rally to the upside, we could see a decline down to the neckline to form the head and shoulders pattern which could then pave way for a decline down to 117.15 levels on a successful break of the neckline. The pattern could be invalidated should we notice a rally, rising above the current levels of 119.
GBPUSD Daily Pivots
| R3 | 1.5483 |
| R2 | 1.5443 |
| R1 | 1.5397 |
| Pivot | 1.5357 |
| S1 | 1.5312 |
| S2 | 1.527 |
| S3 | 1.5225 |
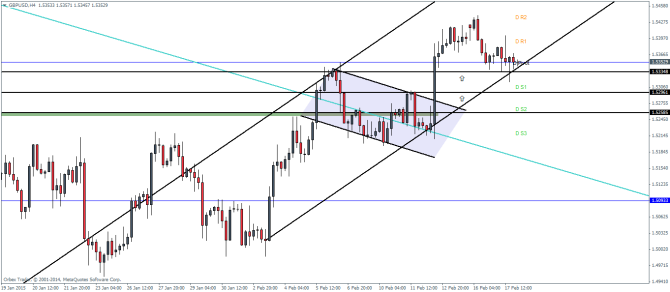
GBPUSD briefly tested the support at 1.533 yesterday but we expect a clear test at this level with a possible close. A break above the short term high at 1.536 could see a the bullish flag rally resume, which could then pave way for the previous highs at 1.543 followed by 1.553. To the downside, a break below 1.533 could see the next support being tested at 1.53 and eventually 1.5258, which would weaken the bull flag pattern and invalidate the analysis.
