EURUSD Daily Pivots
| R3 | 1.151 |
| R2 | 1.1456 |
| R1 | 1.1401 |
| Pivot | 1.1347 |
| S1 | 1.1292 |
| S2 | 1.1238 |
| S3 | 1.1184 |
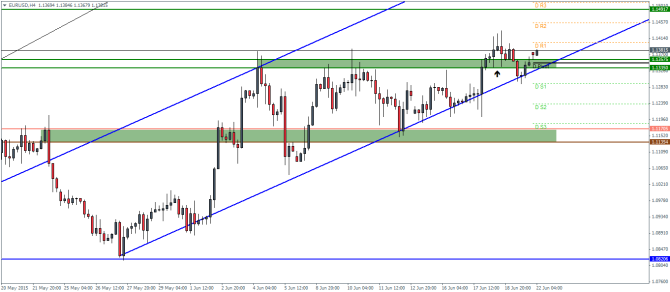
EURUSD (1.138): EURUSD closed Friday with a near doji type of candlestick pattern which was preceded by a shooting star candlestick pattern. In this aspect, the bias is shifted to the downside. However a close above the high over the shooting star is needed to keep the bullish momentum going.
On the intraday charts, price looks to have cleared the region of support/resistance at 1.13575. A retest to this level will see EURUSD test the next resistance at 1.149 level. Alternatively, a break below the support/resistance between 1.13575 and 1.13350 could see a decline on break of the lower trend line of the price channel to test the next support near 1.11705.
USDJPY Daily Pivots
| R3 | 123.737 |
| R2 | 123.472 |
| R1 | 123.08 |
| Pivot | 122.81 |
| S1 | 122.423 |
| S2 | 122.158 |
| S3 | 121.765 |
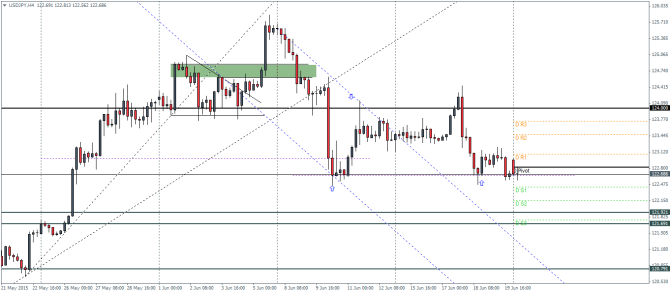
USDJPY (122.68): USDJPY continues to print bearish candlesticks on the daily chart for the past three sessions after forming a shooting star type of pattern. On the intraday charts, price action is showing signs of stalling the bearish momentum near 122.658 minor support. A break below this level could se a test to 121.92 – 121.7 level of support.
The current price action near 122.658 could form a potential double bottom which could potentially shift the bias in USDJPY to the upside. In this aspect a test of 124 is essential and could offer early clues.
GBPUSD Daily Pivots
| R3 | 1.5964 |
| R2 | 1.5930 |
| R1 | 1.5903 |
| Pivot | 1.5868 |
| S1 | 1.5843 |
| S2 | 1.5808 |
| S3 | 1.5781 |
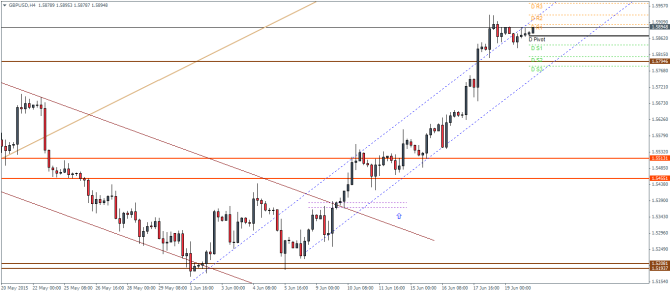
GBPUSD (1.589): GBPUSD managed to reach the price level of 1.59 last week and Friday’s candlestick closed with a doji pattern. This could represent a potential exhaustion of the current rally and could spell a short term correction. The support at 1.57525 could possibly hold the correction.
On the intraday charts, price has broken to the upside of the rising price channel. We expect a possible decline to 1.58 region of broken resistance to be tested for support. A break below 1.58 could see GBPUSD decline to 1.551 level of support after a potential break of the rising price channel.
In our latest podcast we digest the dollar dove dive, update on Greece and preview next week’s events.
