EURUSD Daily Pivots
| R3 | 1.1524 |
| R2 | 1.1479 |
| R1 | 1.1418 |
| Pivot | 1.1373 |
| S1 | 1.1312 |
| S2 | 1.1268 |
| S3 | 1.1207 |
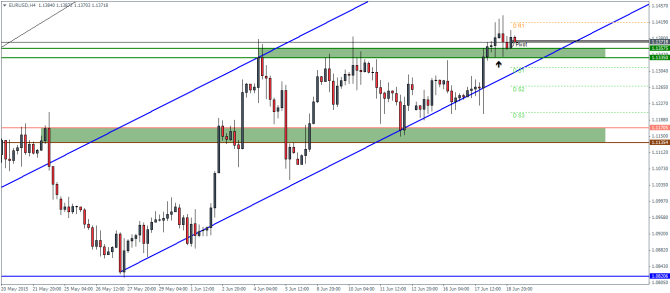
EURUSD (1.137): EURUSD saw another bullish day yesterday but failed to close at the highs, resulting in a small bodied candlestick pattern. With prices however trading above the daily resistance level at 1.12845, the bias remains to the upside, despite the risks that we could see a possible decline to the daily resistance level to establish support.
On the intraday charts, EURUSD is seen consolidating just above the resistance zone at 1.13575 through 1.1335. As long as this level holds, EURUSD is poised to test the next resistance at 1.149 or 1.15.
USDJPY Daily Pivots
| R3 | 124.678 |
| R2 | 124.139 |
| R1 | 123.55 |
| Pivot | 123.011 |
| S1 | 122.423 |
| S2 | 121.883 |
| S3 | 121.287 |
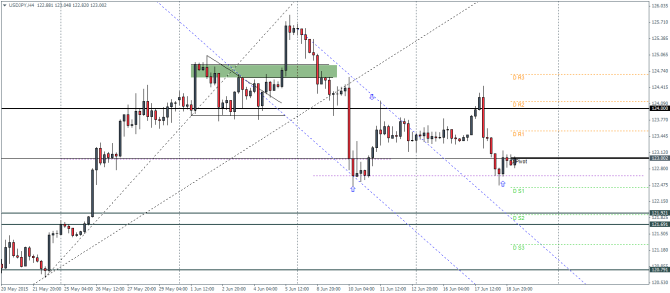
USDJPY (122.99): USDJPY broke down from the resistance level at 124 to trade near the 123 level of support and resistance. Price action is consolidating here and we expect to see further downside in store towards 122 level of support. There is a small chance that the current price action has formed a near double bottom at 122.66. Therefore, USDJPY will need to break the support at 122.66 in order to decline towards 122.
In the event the double bottom holds, USDJPY could possibly retest previous resistance at 124 and eventually target 125.2, the measured move of the double bottom pattern.
GBPUSD Daily Pivots
| R3 | 1.6060 |
| R2 | 1.5995 |
| R1 | 1.5936 |
| Pivot | 1.587 |
| S1 | 1.5811 |
| S2 | 1.5747 |
| S3 | 1.5688 |
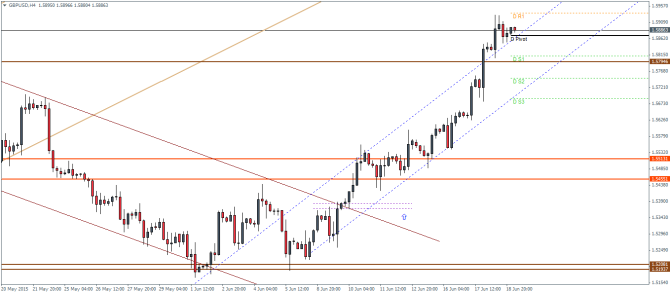
GBPUSD (1.588): GBPUSD’s rally has been rather fast as prices have broken above 1.57525 to test the next resistance at 1.59. We expect a possible decline to 1.57525 to establish support at this freshly broken resistance which could then set the stage for further gains.
On the intraday charts, we expect a dip to 1.58 (to 1.57525). In the larger scheme of things, the recent break out from the falling price channel could be viewed as a major bull flag. This gives us a potential target to 1.62 and 1.65 as the longer term goals..
In our latest podcast we digest the dollar dove dive, update on Greece and preview next week’s events.
