EURUSD Daily Analysis
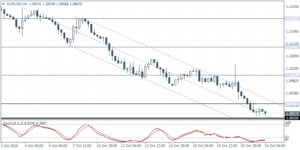
EURUSD (1.0867): EURUSD is seen continuing its decline in early Asian trading session today, and the downside target of 1.0850 is now likely to be reached. This potentially marks the end of the head and shoulders pattern that was formed on the daily chart over the course of August and September. On the 4-hour chart, the price has managed to respect the falling median line with the downtrend moving steadily lower. Watch for a potential rebound of 1.0850 support which could see a retest back to 1.1000 on a breakout above 1.0900 as we await further clues from the Stochastics indicator.
USDJPY Daily Analysis
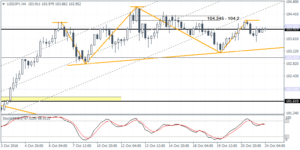
USDJPY (103.95): USDJPY rallied back to 104.00 region on Friday and price action remains trading within the inside bar’s range from 13 October. With nearly a week of sideways range, the breakout from this range can be expected in the near term. To the upside, above 104.63, the further upside can be expected with the price likely to target 106.00 resistance that as tested briefly around July this year, while to the downside, a breakout below 103.33 will see the price correct lower to 102.00 – 101.61 support. The short-term resistance at 104.34 – 104.20 will be key as a daily close above 104.20 could invalidate the bearish bias.
NZDUSD Daily Analysis
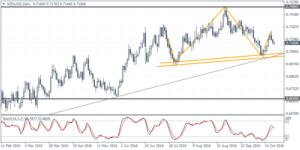
NZDUSD (0.7160): NZDUSD has been carving out a potential head and shoulders pattern on the daily chart with the right shoulder currently evolving. Neckline support is seen near 0.7049 – 0.6959. A breakdown below this level could signal further declines in NZDUSD which could potentially target the measured move towards 0.6659. For the moment, the Stochastics is seen currently pushing lower and could indicate near term declines. The neckline support could be acting as a strong level offering a rebound in prices in the near term. The H&S pattern on the daily can be validated only on a break down below 0.7049 – 0.6959.
