- Fantom price has seen a considerable surge of 300% in the last week.
- FTM could see a pullback or a correction as Tom DeMark Sequential indicator has flashed a sell signal.
- A breakdown of immediate support at $0.55 could result in a 15% correction.
- However, a four-hour candlestick close above $0.81 could invalidate the bearish thesis.
Fantom price has returned an excessive of 3,800% in just 56 days. Now, FTM shows signs of exhaustion and could see a steep correction soon.
Fantom price eyes a lower low
In the last week alone, Fantom price rose a whopping 300% from $0.16 to $0.66. However, the Tom DeMarket Sequential indicator has flashed a sell signal in the form of a green nine candlestick on the 4-hour chart. The setup forecasts a one to four candlestick correction.
Interestingly, the last two times FTM saw this sell signal, its price dropped roughly 30%. Assuming a similar turn of events, Fantom could be poised for a pullback.
In case of a reversal, Fantom price could see a retest of the support level at $0.55 or the 78.6% Fibonacci retracement level. If this crucial demand barrier is breached, FMT could see a correction of 20% to $0.46 or the 61.8% Fibonacci retracement level.
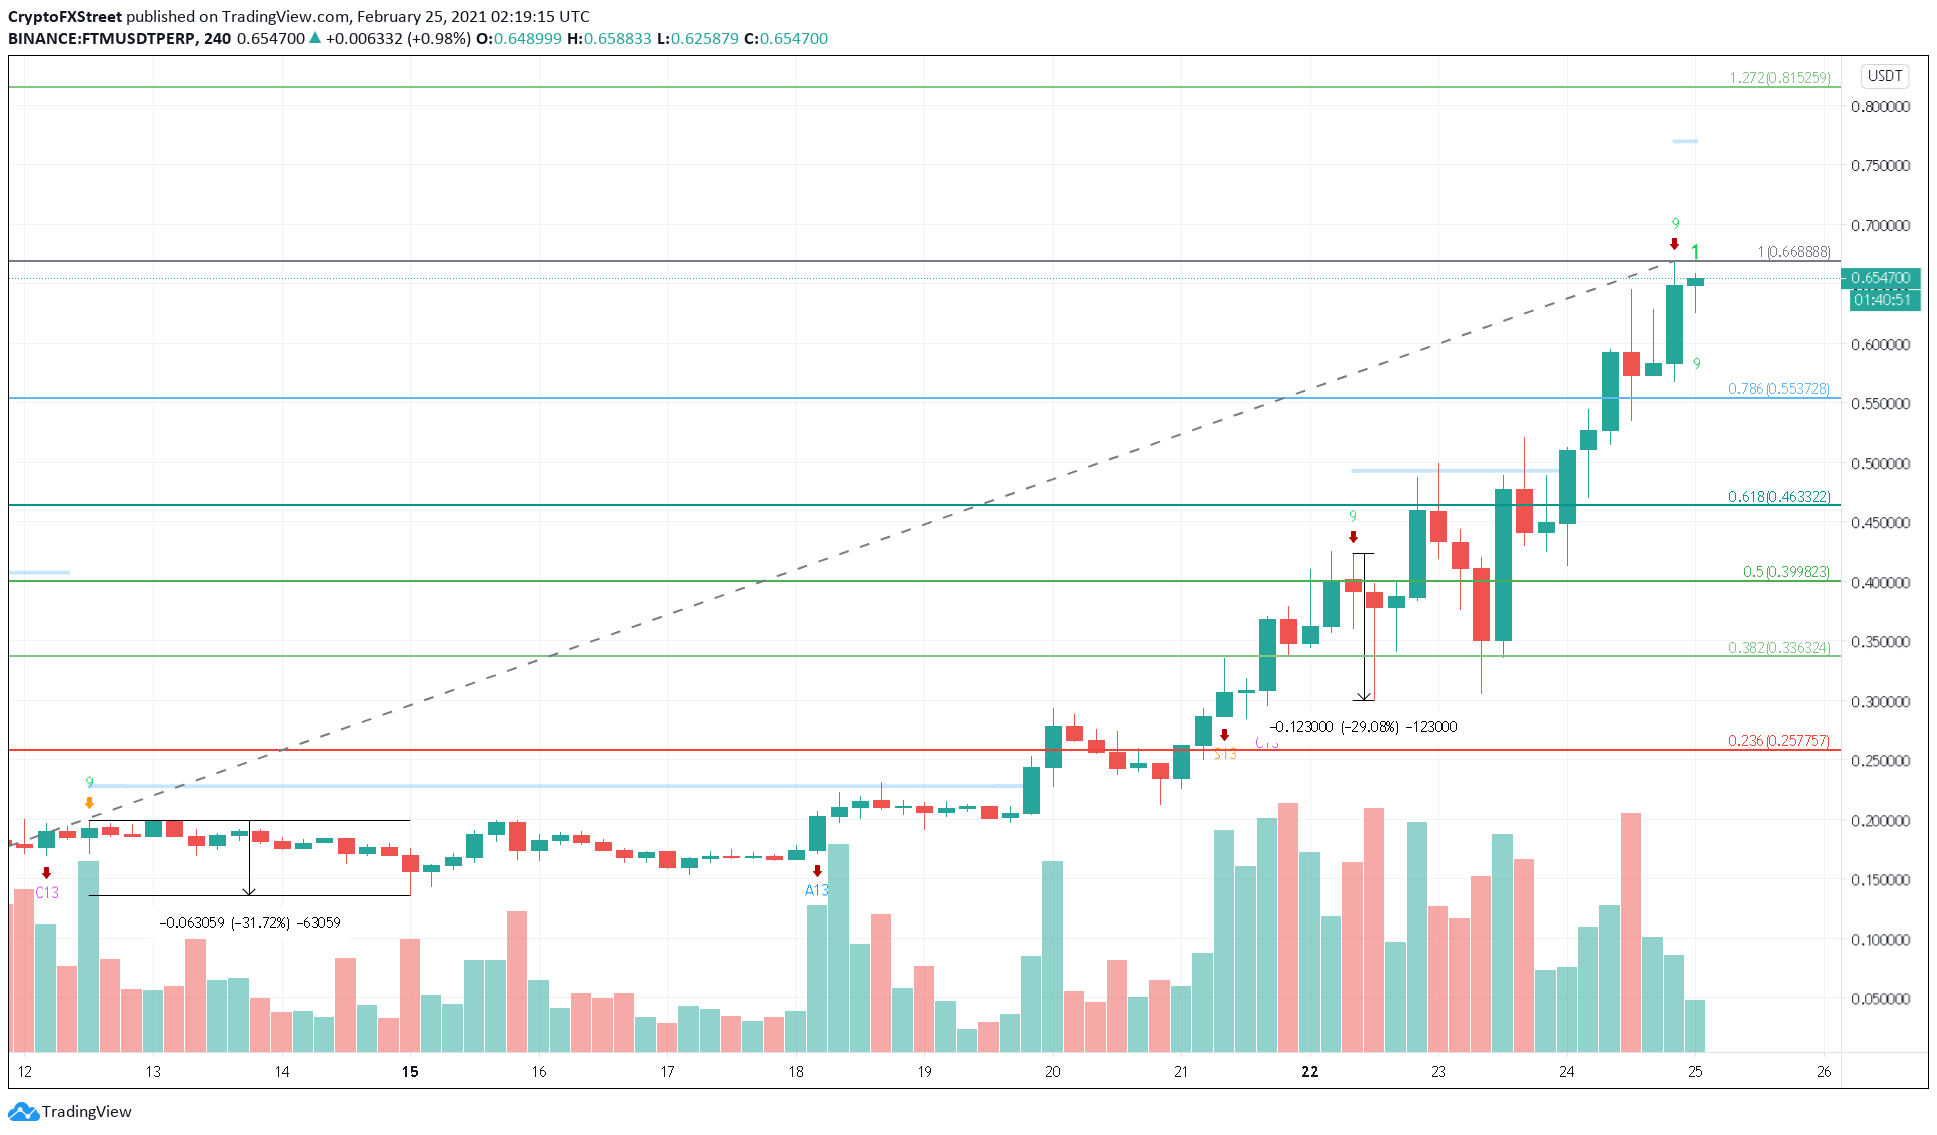
FTM/USDT 4-hour chart
Investors also need to be aware of the TD Sequential indicator’s looming sell signal on the 1-day chart. At the time of writing, the indicator has presented a green eight candlestick, which hints at an incoming reversal or a correction in Fantom price soon.
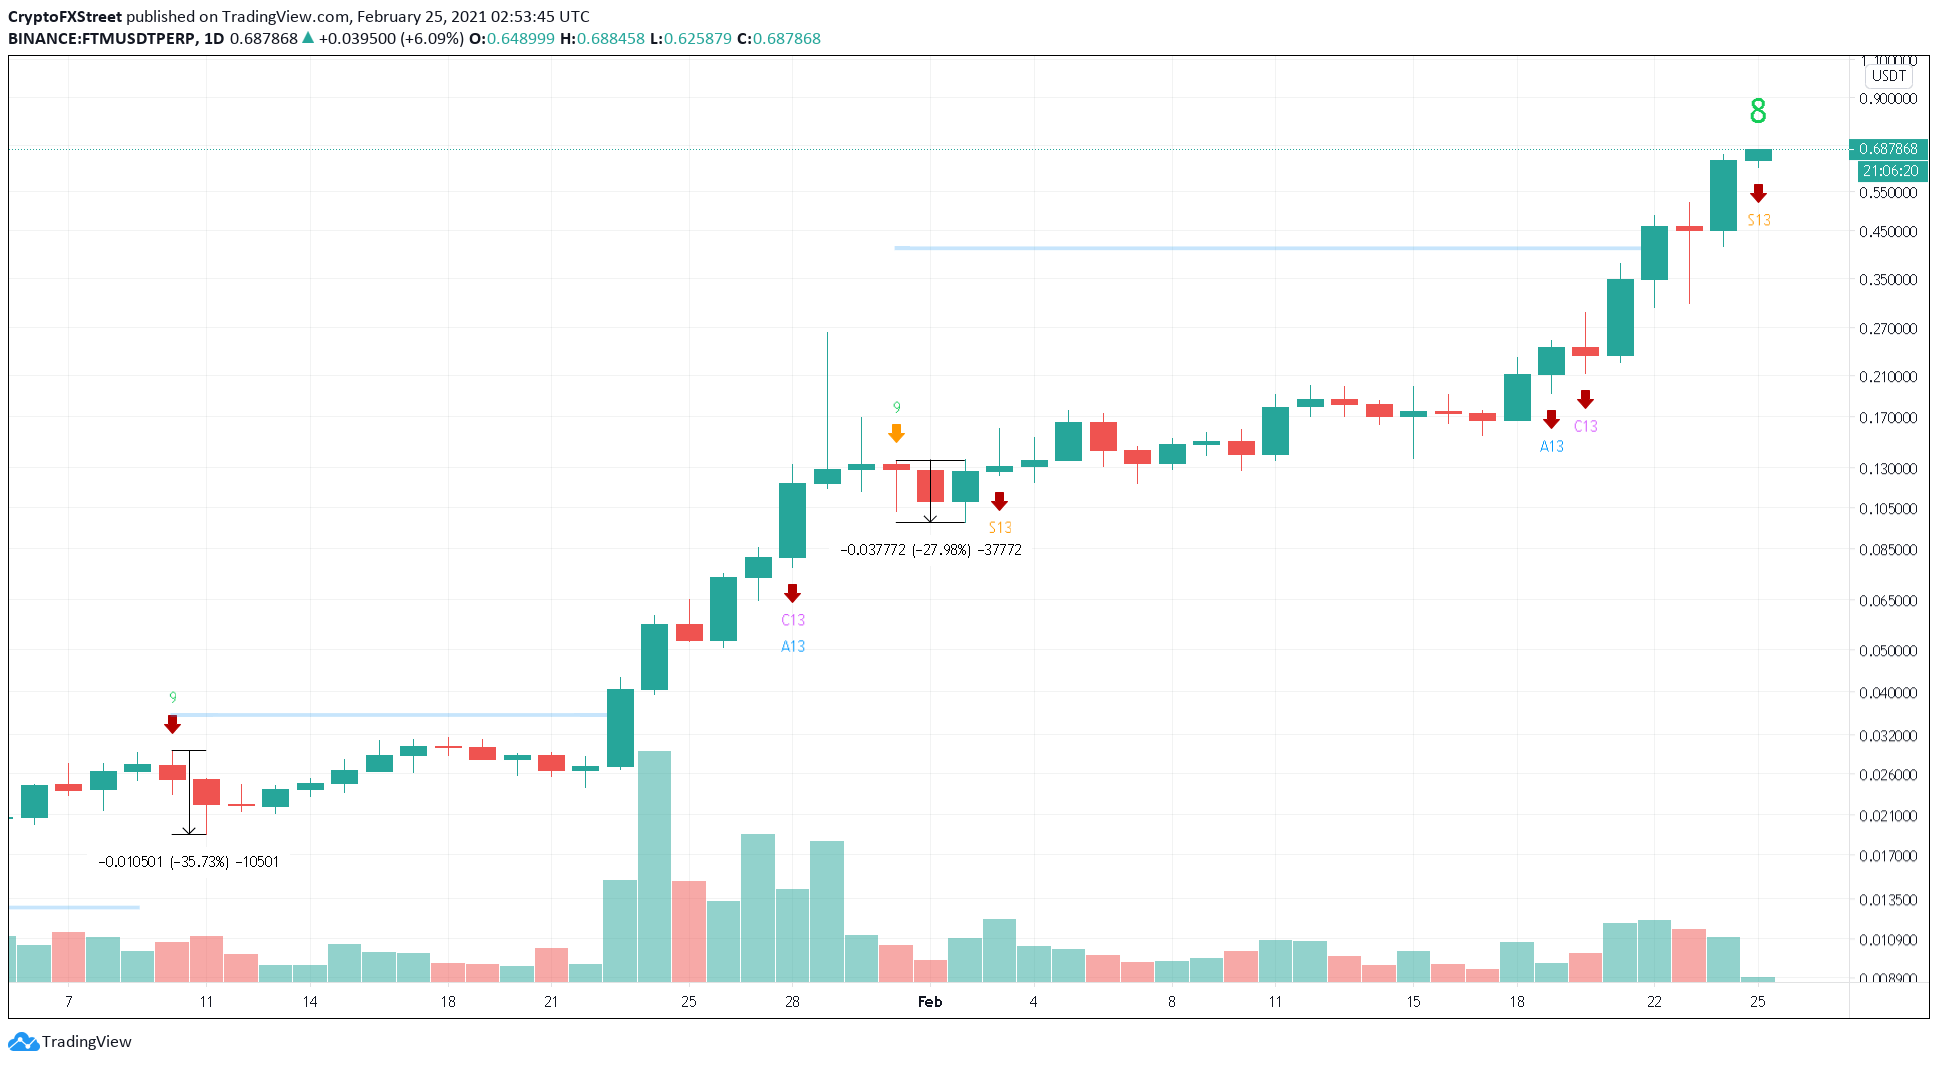
FTM/USDT 1-day chart
On the other hand, FOMO-led rally leading to a spike in buying pressure could easily ignore and invalidate the sell signals. In such a case, Fantom price could rally 20% to hit a new all-time high at $0.81, which coincides with the 127.2% Fibonacci retracement level.
A 4-hour candlestick close above this level could propel the coin $1 or the 161.88% Fibonacci retracement level.
