- GBP/AUD consolidates between key structures on the monthly, weekly and daily chart.
- Bears looking for prospects below daily support for confirmations.
GBP/AUD has printed a long wick within a monthly right-hand shoulder of the Head and Shoulders.
This wick is expected to be filled-in on lower time frames which could equate to a medium-term bearish breakout.
The following is a topdown analysis starting from the monthly chart, then weekly and daily.
Monthly chart (i)
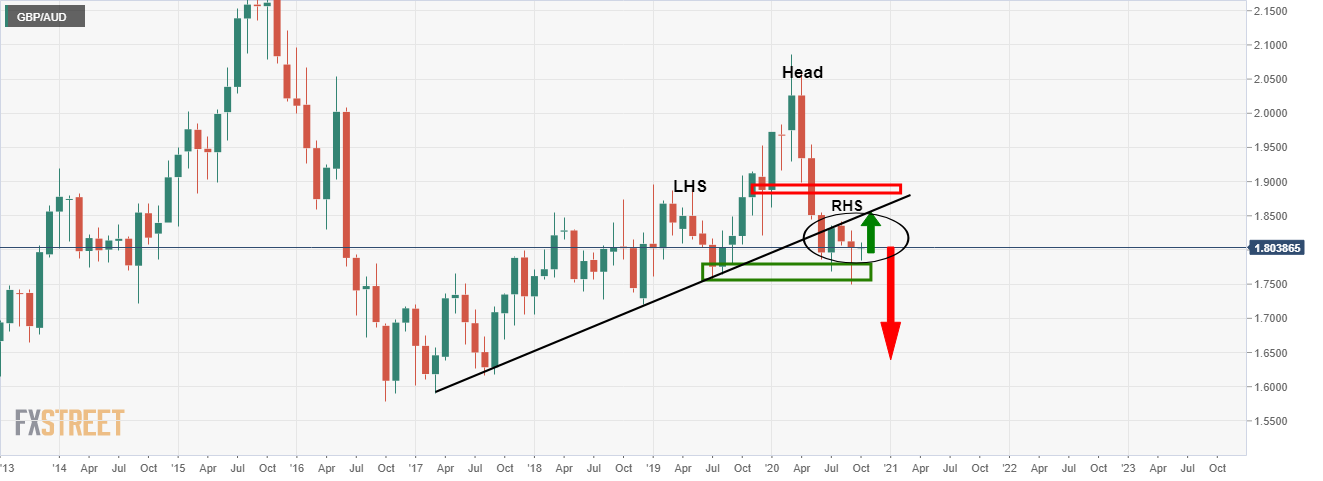
At this juncture, the price has been building a right-hand shoulder which could result in a break below the current support structure.
Monthly chart (ii)
-637374516645488976.png)
If there is not an immediate upside move back to the counter trendline, the wick will be filled in on a lower time frame.
Weekly chart
-637374516906302920.png)
The above is the price action within the wick which meets a fresh resistance structure.
If this holds, there are the prospects of a downside breakout.
Daily chart
-637374517608110199.png)
The daily chart is somewhat more convincing on the downside but there is little to be done until the support structure is broken at which point the 4-hour chart can be monitored for a bearish technical environment.
