- GBP/AUD is taking the round of bids near 1.8640 during early Wednesday.
- The pair grew from 1.8550 to the intra-day high near 1.8645 after gross domestic product (GDP) figures from Australia weakened on a quarterly basis.
- The fourth quarter (Q4) GDP figure lagged behind 0.3% market consensus and prior to 0.2% on quarterly basis whereas yearly comparison show 2.3% growth from the 2.8% registered during the same time last year and 2.5% forecast.
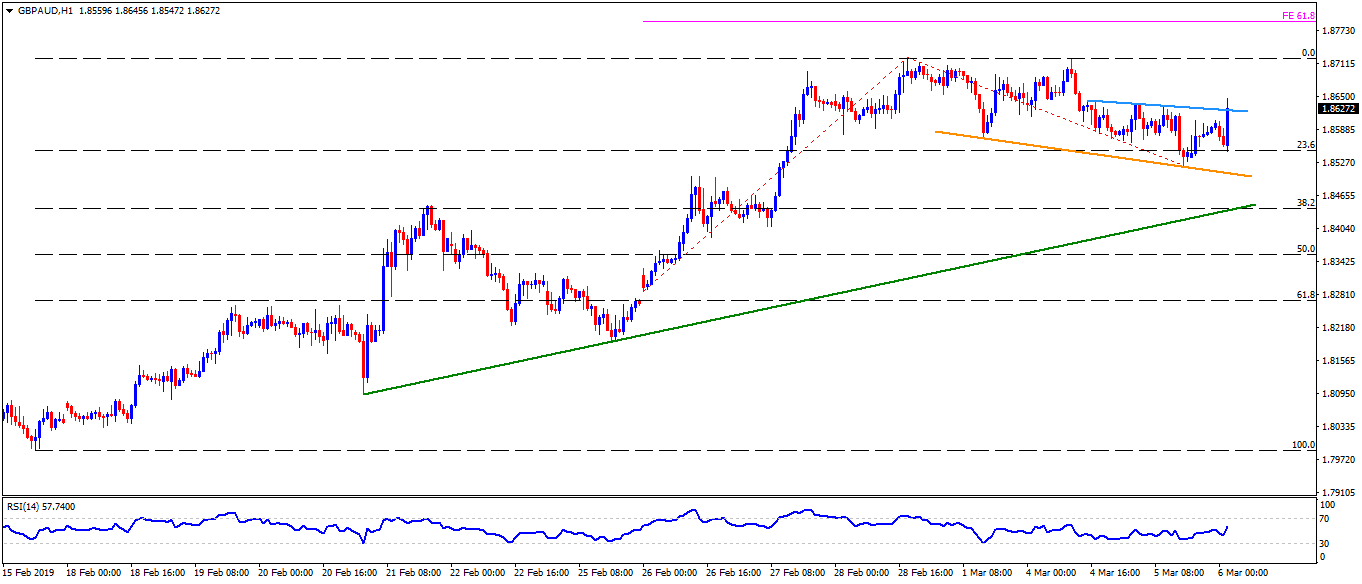
- After the release, the GBP/AUD pair broke descending trend-line resistance, at 1.8625, that joins the highs since late-Monday.
- As a result, buyers may now aim for 1.8720/25 area comprising highs marked in February and March till present.
- Given the pair crosses 1.8725 upside barrier, 61.8% Fibonacci expansion level of 1.8795 may lure the Bulls.
- Meanwhile, pullback under 1.8625 resistance-turned-support can well drag the quote to 23.6% Fibonacci retracement level of 1.8545 while a downward sloping trend-line at 1.8500 could restrict additional declines.
- If at all sellers refrain from respecting 1.8500 support, an ascending support-line stretched since February 21, coupled with 38.2% Fibonacci, might flash the 1.8440 on their radar.
GBP/AUD hourly chart
GBP/AUD
Overview:
Today Last Price: 1.8628
Today Daily change: 0.0033 pips
Today Daily change %: 0.18%
Today Daily Open: 1.8595
Trends:
Daily SMA20: 1.8318
Daily SMA50: 1.8146
Daily SMA100: 1.7986
Daily SMA200: 1.7925
Levels:
Previous Daily High: 1.8639
Previous Daily Low: 1.8524
Previous Weekly High: 1.8725
Previous Weekly Low: 1.8195
Previous Monthly High: 1.8725
Previous Monthly Low: 1.7869
Daily Fibonacci 38.2%: 1.8595
Daily Fibonacci 61.8%: 1.8568
Daily Pivot Point S1: 1.8533
Daily Pivot Point S2: 1.847
Daily Pivot Point S3: 1.8417
Daily Pivot Point R1: 1.8649
Daily Pivot Point R2: 1.8702
Daily Pivot Point R3: 1.8764
