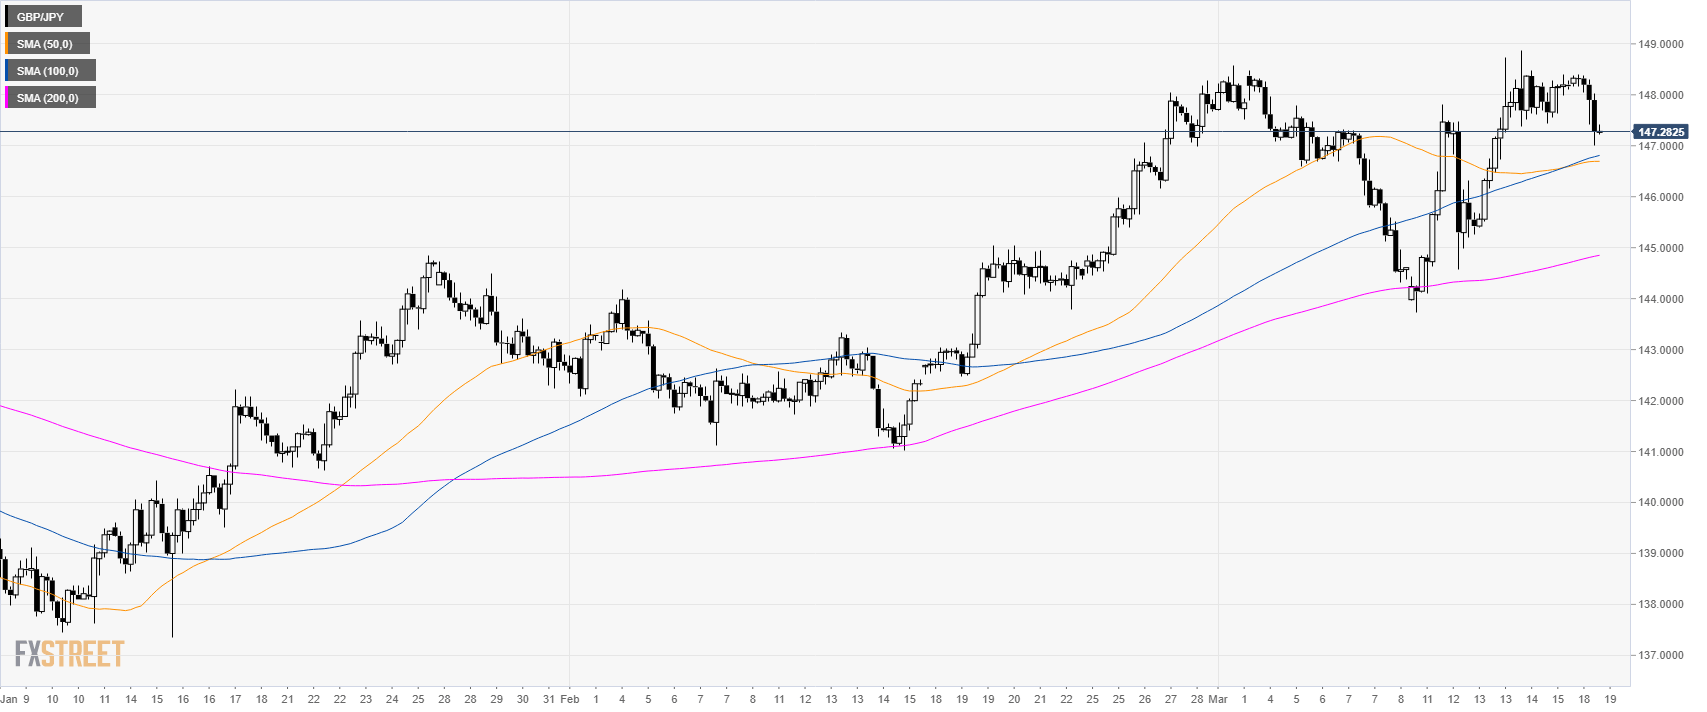
GBP/JPY daily chart
- GBP/JPY is trading above its main simple moving averages (SMAs) suggesting a bullish bias.

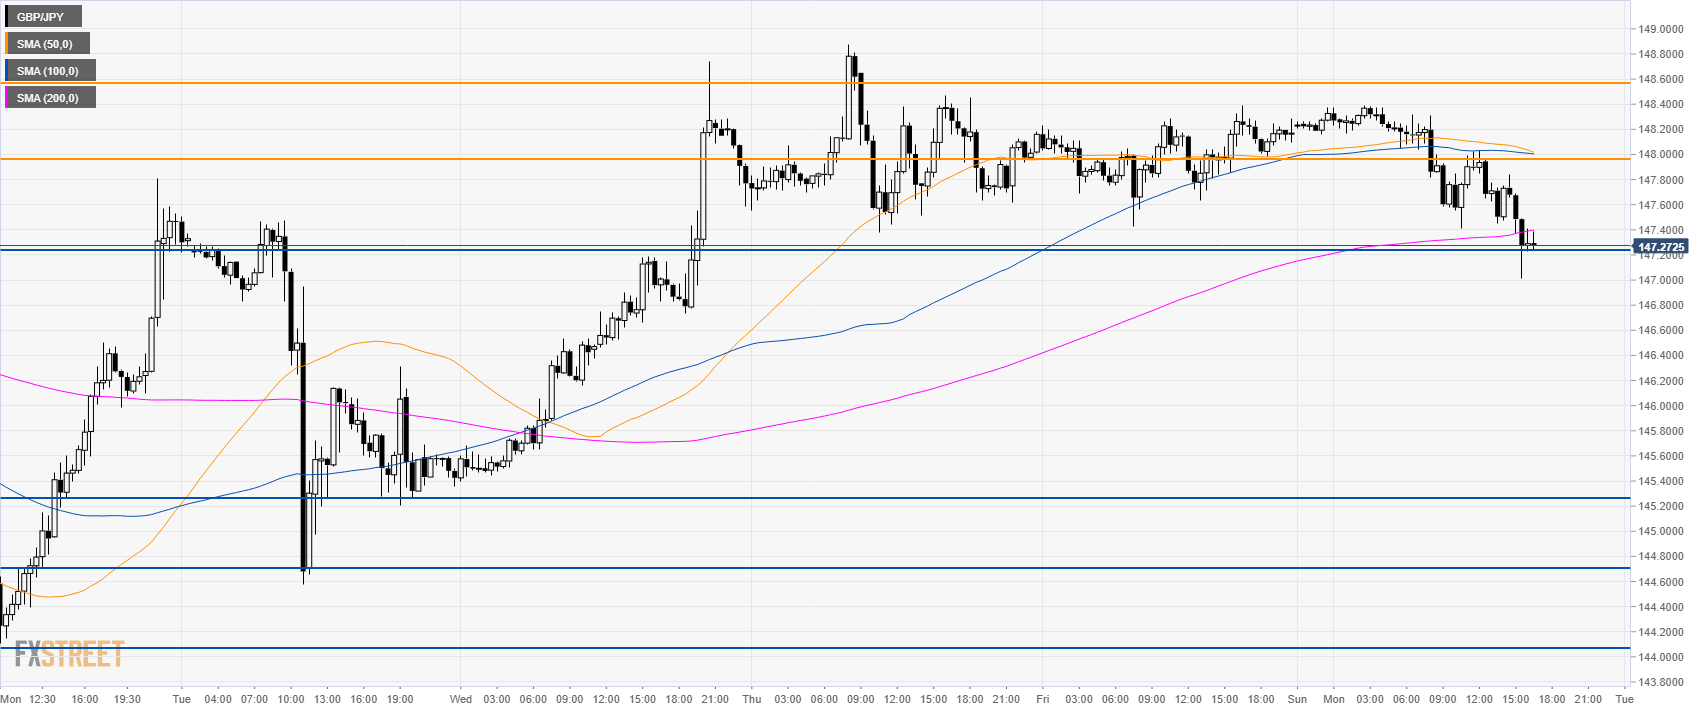
GBP/JPY 4-hour chart
- GBP/JPY is trading above its main SMAs suggesting bullish momentum in the medium-term.
GBP/JPY 30-minute chart
- GBP/JPY is trading below its main SMAs suggesting bearish momentum in the short-term.
- A break below 147.20 can lead to 145.20 support.
- Resistance is at 148.00 figure and 148.60 level.
Additional key levels
GBP/JPY
Overview:
Today Last Price: 147.29
Today Daily change: -88 pips
Today Daily change %: -0.59%
Today Daily Open: 148.17
Trends:
Daily SMA20: 146.25
Daily SMA50: 143.48
Daily SMA100: 143.55
Daily SMA200: 144.67
Levels:
Previous Daily High: 148.39
Previous Daily Low: 147.43
Previous Weekly High: 148.88
Previous Weekly Low: 143.72
Previous Monthly High: 148.28
Previous Monthly Low: 141.01
Daily Fibonacci 38.2%: 148.02
Daily Fibonacci 61.8%: 147.8
Daily Pivot Point S1: 147.6
Daily Pivot Point S2: 147.04
Daily Pivot Point S3: 146.64
Daily Pivot Point R1: 148.56
Daily Pivot Point R2: 148.96
Daily Pivot Point R3: 149.52
