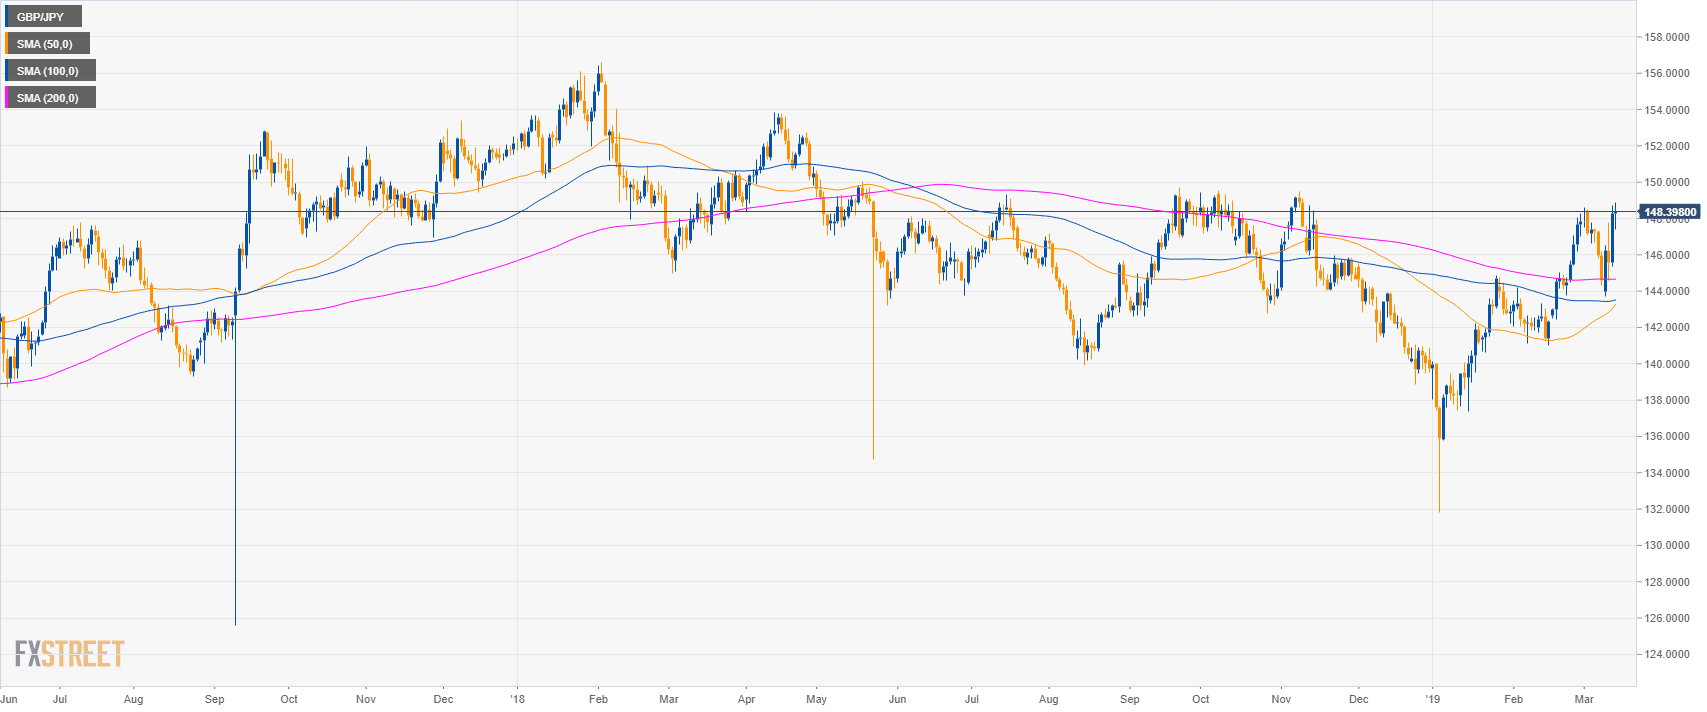
GBP/JPY daily chart
- GBP/JPY is trading in a bull leg above its main simple moving averages (SMAs).
- The Sterling can see high volatility as the UK’s Parliamentary vote on Brexit is starting at 17.00 GMT.
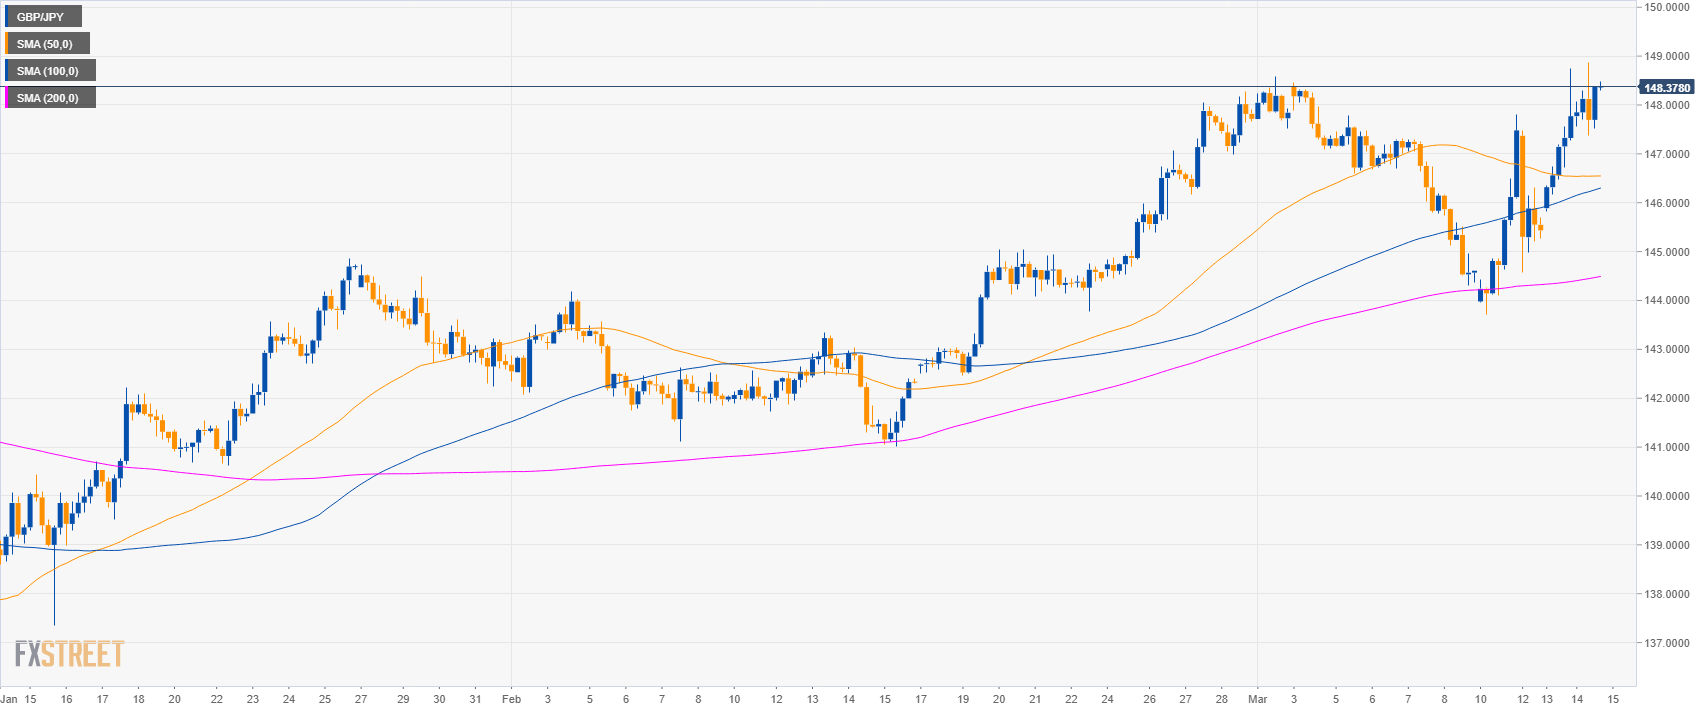
GBP/JPY 4-hour chart
- GBP/JPY is trading above its main SMAs suggesting a bullish momentum in the medium-term.
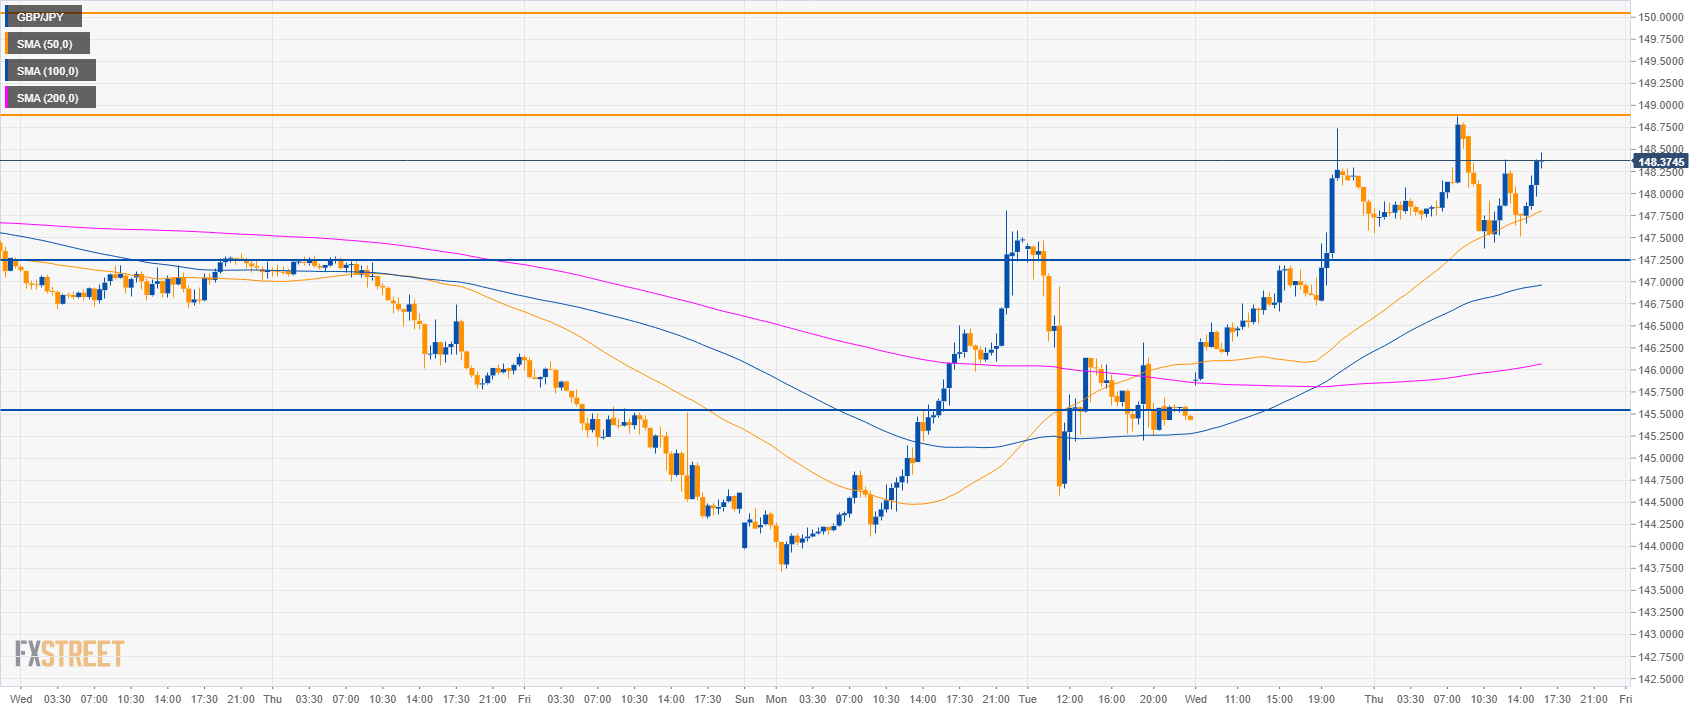
GBP/JPY 30-minute chart
- GBP/JPY is trading above its main SMAs suggesting a bullish momentum in the short-term.
- A break above 149.00 can lead to 150.00 and 151.50 resistances.
- Supports are at 145.25, 144.75 and 144.00 level.
Additional key levels
GBP/JPY
Overview:
Today Last Price: 148.29
Today Daily change: 2 pips
Today Daily change %: 0.01%
Today Daily Open: 148.27
Trends:
Daily SMA20: 145.63
Daily SMA50: 143.04
Daily SMA100: 143.47
Daily SMA200: 144.66
Levels:
Previous Daily High: 148.74
Previous Daily Low: 145.36
Previous Weekly High: 148.47
Previous Weekly Low: 144.31
Previous Monthly High: 148.28
Previous Monthly Low: 141.01
Daily Fibonacci 38.2%: 147.45
Daily Fibonacci 61.8%: 146.65
Daily Pivot Point S1: 146.18
Daily Pivot Point S2: 144.09
Daily Pivot Point S3: 142.81
Daily Pivot Point R1: 149.55
Daily Pivot Point R2: 150.83
Daily Pivot Point R3: 152.92
