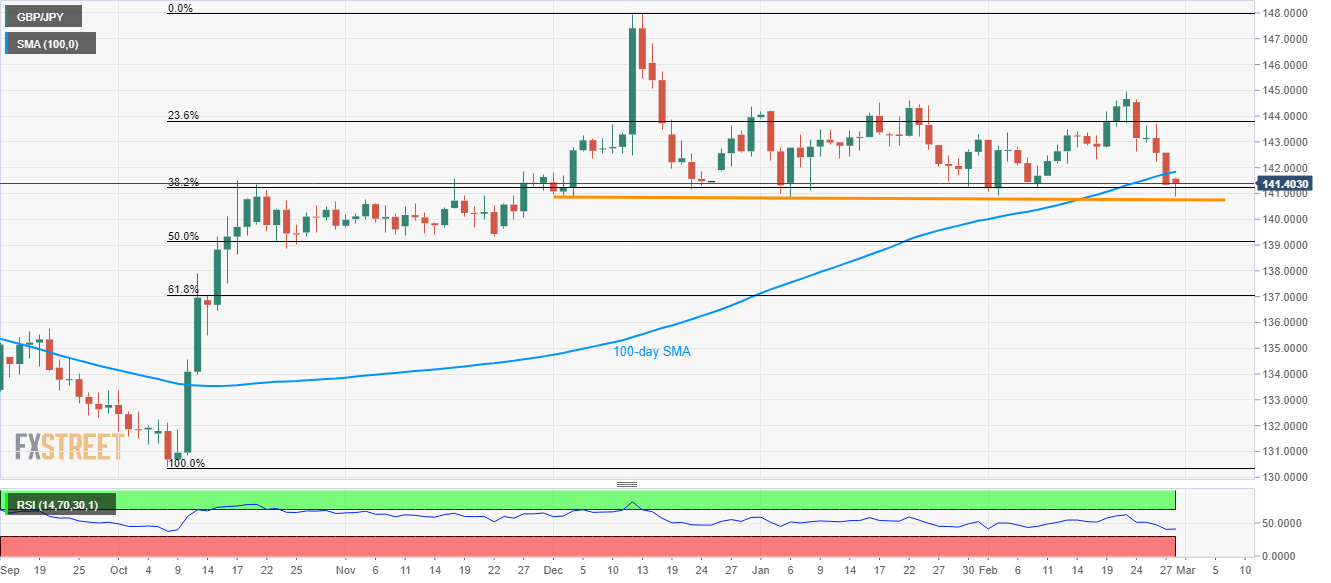
- GBP/JPY struggles around near-term horizontal support.
- Buyers will look for entry beyond 100-day SMA.
- A downside break can take aim at 50% Fibonacci retracement.
GBP/JPY pulls back from seven-week low while trading around 140.30 during Friday’s Asian session. Even so, the pair nears the key horizontal support established since early December 2019 after the quote slipped below 100-day SMA the previous day.
Hence, sellers will look for entry below 140.85/80 support while targeting 50% Fibonacci retracement of October-December 2019 upside, near 139.20.
However, pair’s further declines could be questioned around 138.70, if not then 61.8% of Fibonacci retracement close to 137.10 will be on the bears’ radars.
On the upside, buyers will refrain from entering unless GBP/JPY prices bounce back beyond a 100-day SMA level of 141.85.
In doing so, 142.60, 143.40 and 23.6% Fibonacci retracement level of 143.83 can offer intermediate halts during the recovery challenging the monthly high close to 145.00.
GBP/JPY daily chart
Trend: Pullback expected

