- GBP/JPY remains on the back foot, seesaws around the multi-week low.
- 200-day SMA and 50% Fibonacci can trigger pullbacks to November 2019 low amid oversold RSI.
- A downside break can test 135.75/65 horizontal support.
GBP/JPY trades around 137.76 during the Asian session on Monday. In doing so, the pair bounces off 50% Fibonacci retracement of August-December 2019 upside while taking rounds to 200-day SMA amid oversold RSI conditions.
That said, the pair is expected to witness a pullback towards November 2019 low close to 139.35 whereas 140.00 could question the pair’s further recovery.
It should also be noted that the bears’ are less likely to be defied, even for short-term, unless the quote rises beyond the early-February low near 141.00.
On the downside, pair’s daily closing below 50% Fibonacci retracement level of 137.27 can extend the south-run towards 135.75/65 horizontal area that includes highs marked during late-July 2019 and September 2019.
Also adding to the support is 61.8% Fibonacci retracement level of 134.75.
GBP/JPY daily chart
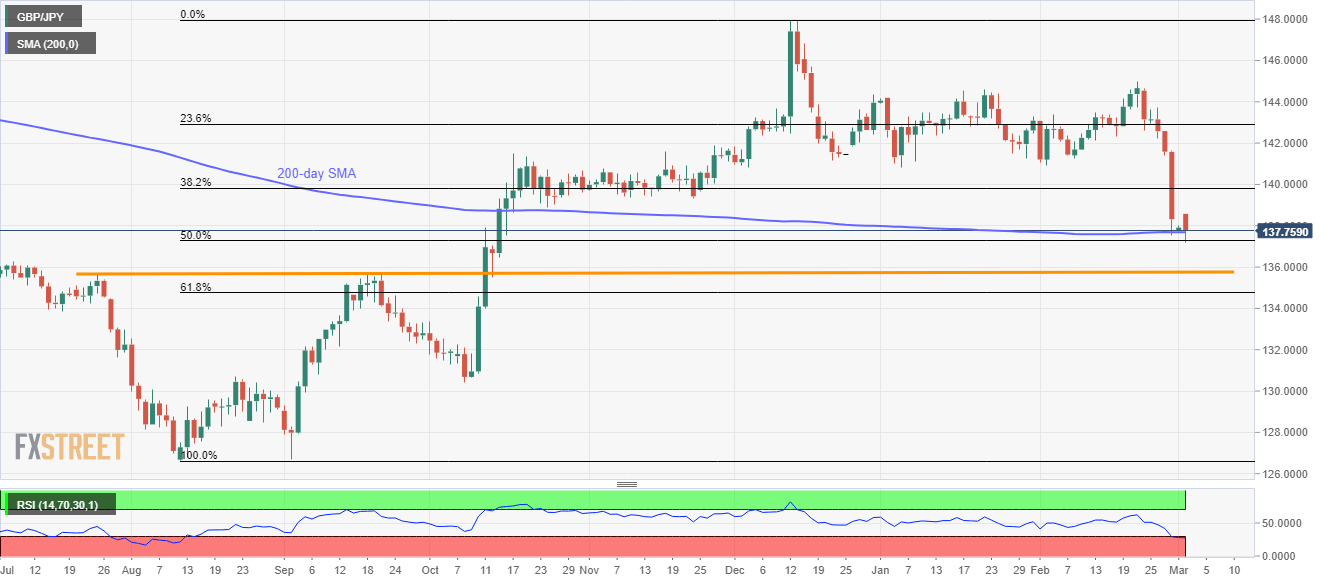
Trend: Pullback expected
