- GBP/JPY bounces off five-month low amid oversold RSI.
- Horizontal support from August 2019 can question further declines.
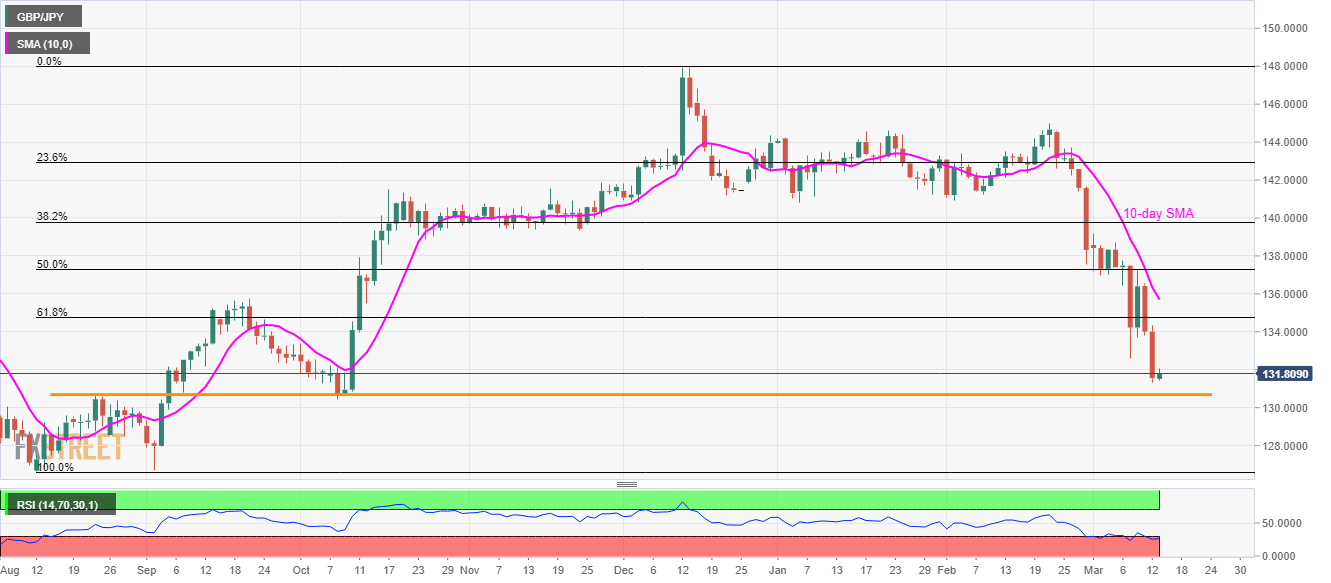
With the bears catching a breath amid oversold RSI conditions, GBP/JPY recovers to 131.80 amid the Asian session on Friday. Even so, the pair’s sustained trading below 61.8% Fibonacci retracement of August-December 2019 upside keeps the sellers hopeful.
As a result, a horizontal line connecting August 2019 top and October 2019 low, near 130.70, followed by 130.00 round-figure, is likely the next landmark to watch during the fresh declines.
Though, the pair’s further downside below 130.0 will make it vulnerable to revisit the late-2019 lows near 126.60.
Meanwhile, a sustained run-up beyond 134.75 level, comprising 61.8% Fibonacci retracement, may not lure the bulls as 10-day SMA close to 135.70 also stays on the table to check them.
If at all GBP/JPY prices remain strong above 135.70, 50% of Fibonacci retracement near 137.30 and the monthly high close to 139.20 can return to the charts.
GBP/JPY daily chart
Trend: Pullback expected
