- GBP/JPY is correcting the monthly bullish impulse.
- Bears will eye a significant correction from this juncture.
GB/JPY has stalled in the long-term charts and the focus is now on the downside, as illustrated within the following top-down analysis:
Monthly chart
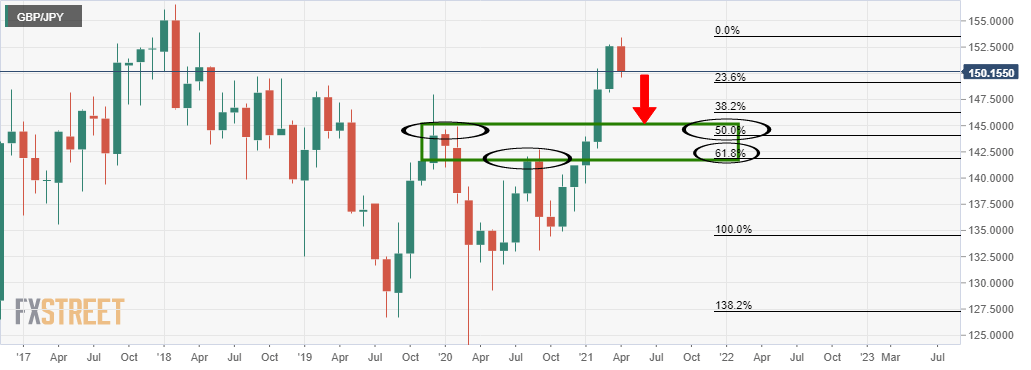
The monthly chart shows that the price has stalled and started to correct putting the prior resistances in view.
This puts the 50% ad 61.8% Fibonacci retracements in focus.
Weekly chart
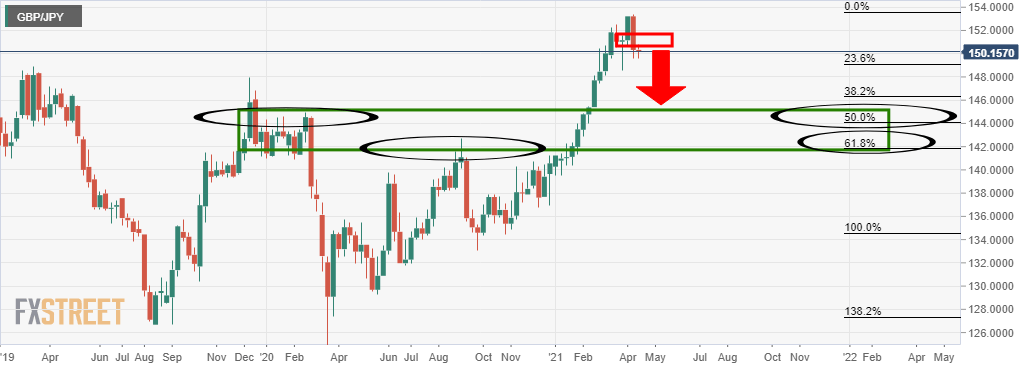
The weekly chart is under pressure and has formed a resistance structure.
Daily chart
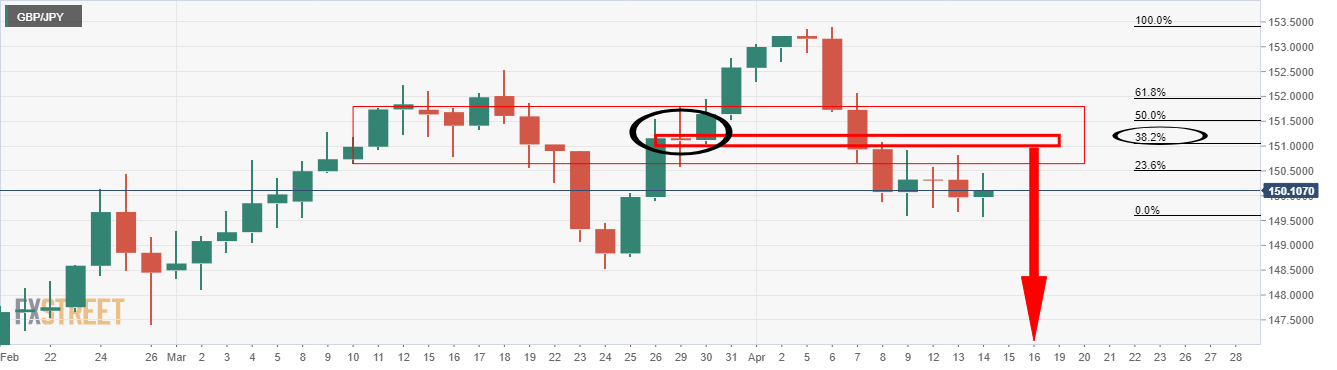
The price may still have some room to the upside at this juncture to fully test the 38.2% Fibonacci retracement of the bearish impulse that aligns with the body of the prior resistance candle.
