- GBP/JPY struggles to extend the latest pullback.
- 61.8% of Fibonacci retracement offers immediate support.
- Buyers will look for entry beyond the fresh monthly top.
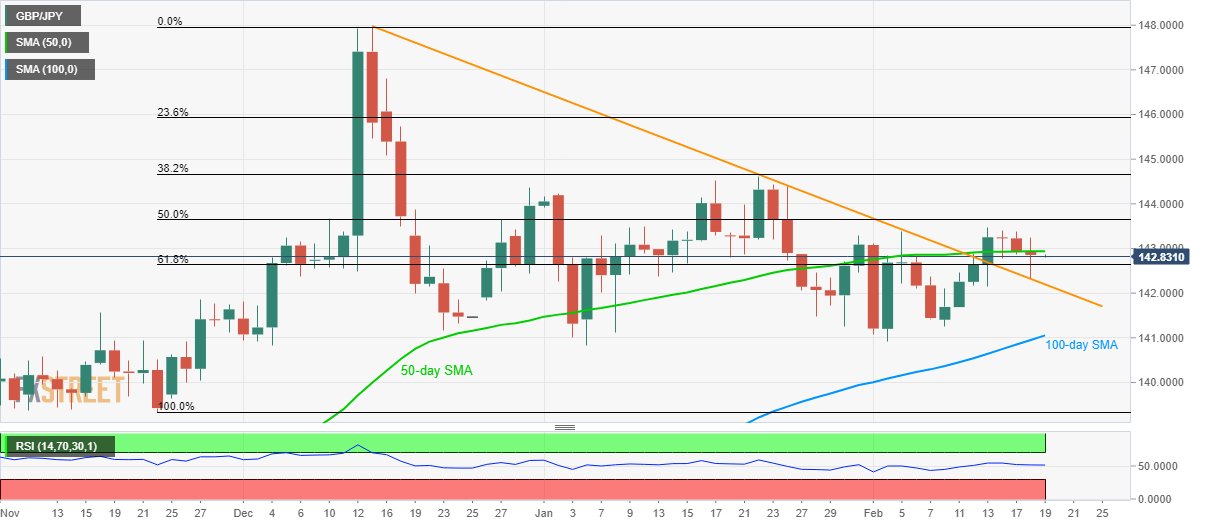
GBP/JPY stays mostly inactive while flashing 142.85 as a quote during Wednesday’s Asian session. That said, the pair recently took a U-turn from 10-week-old resistance-turned-support but remains below 50-day SMA.
With this, the quote is likely to revisit 61.8% Fibonacci retracement of its November-December upside, at 142.63, before retesting the support line, currently at 142.20.
During the pair’s further downside below 142.20, which is less likely considering the current momentum, 100-day SMA level of 141.00 and lows marked during December 2019 and January 2020, around 140.80 could please the bears.
On the upside, pair’s rise past-50-day SMA level of 142.95 again pushes it to challenge the monthly top nearing 143.50.
If GBP/JPY prices manage to clear 143.50 resistance, a 50% Fibonacci retracement level of 143.65 can add challenges to the buyers.
GBP/JPY daily chart
Trend: Sideways
