- GBP/JPY remains positive near three-week top.
- Bullish MACD backs upside break of 100-day EMA to suggest further rise.
- 50% of Fibonacci retracement acts as additional support.
GBP/JPY eases from the intraday top of 135.41 to 135.31 during Thursday’s Asian session. However, the pair still flashes 0.04% gains while staying near the highest since June 16. The quote refreshed the multi-day top on Wednesday after successfully crossing 100-day EMA.
Other than the clearance of the key EMA, bullish MACD also favors the buyers to aim for a 200-day EMA level of 136.13 during further advances.
However, 61.8% Fibonacci retracement of the pair’s February-March fall, around 137.00, will restrict the extra north-run.
Should buyers fail to keep the upside momentum and the quote slips below a 100-day EMA level of 134.82, 50% of Fibonacci retracement near 134.50 could return to the chart.
Additionally, June 23 high close to 134.00 and an upward sloping trend line from May 18, at 132.60 now, will add to the downside support in a case where the sellers dominate.
GBP/JPY daily chart
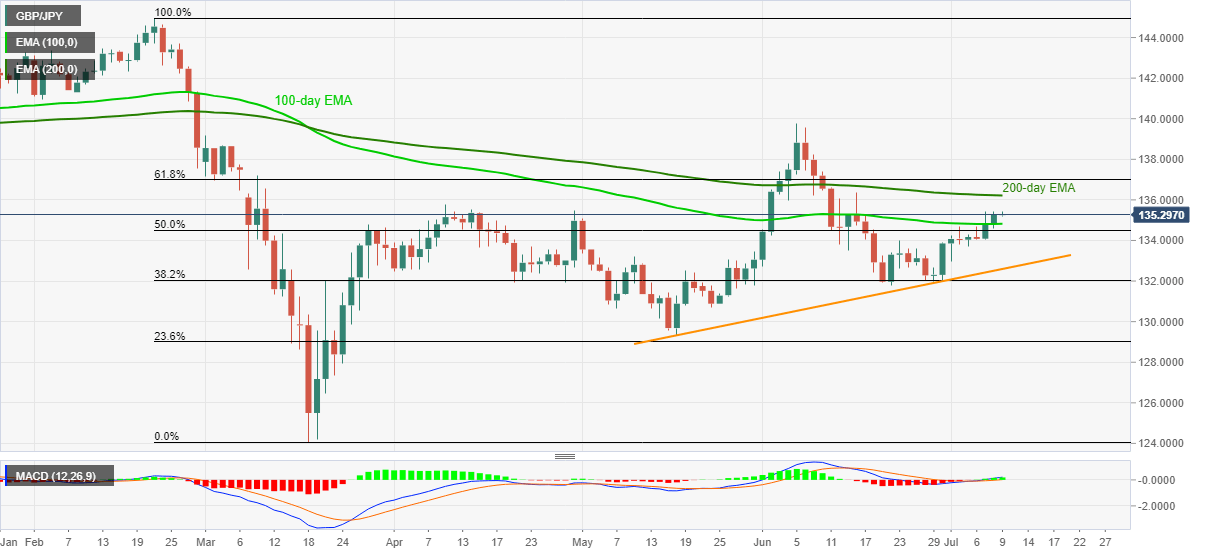
Trend: Bullish
