- GBP/JPY repeats the recent pattern of alternative losses with gains above 50% Fibonacci retracement.
- November low acts as the immediate key upside barrier ahead of 100-day SMA.
- September 2019 tops could please bears below the key Fibonacci support.
GBP/JPY registers mild gains of 0.15% while rising to 137.52 as the Tokyo session begins for Friday. In doing so, the pair takes another U-turn from 50% Fibonacci retracement of its August-December upside.
However, a 200-day SMA level around 137.70 acts as immediate resistance ahead of November 2019 low near 139.30.
Additionally, 38.2% Fibonacci retracement near 139.80, 140.00 round-figure and January month bottom close to 140.80 can keep the bulls checked before directing them towards a 100-day SMA level of 141.80.
Meanwhile, bearish MACD conditions continue to favor the sellers looking for entry below 50% Fibonacci retracement level of 137.30.
In doing so, September 2019 high near 135.75, as well as 61.8% Fibonacci retracement near 134.77, could entertain the bears.
GBP/JPY daily chart
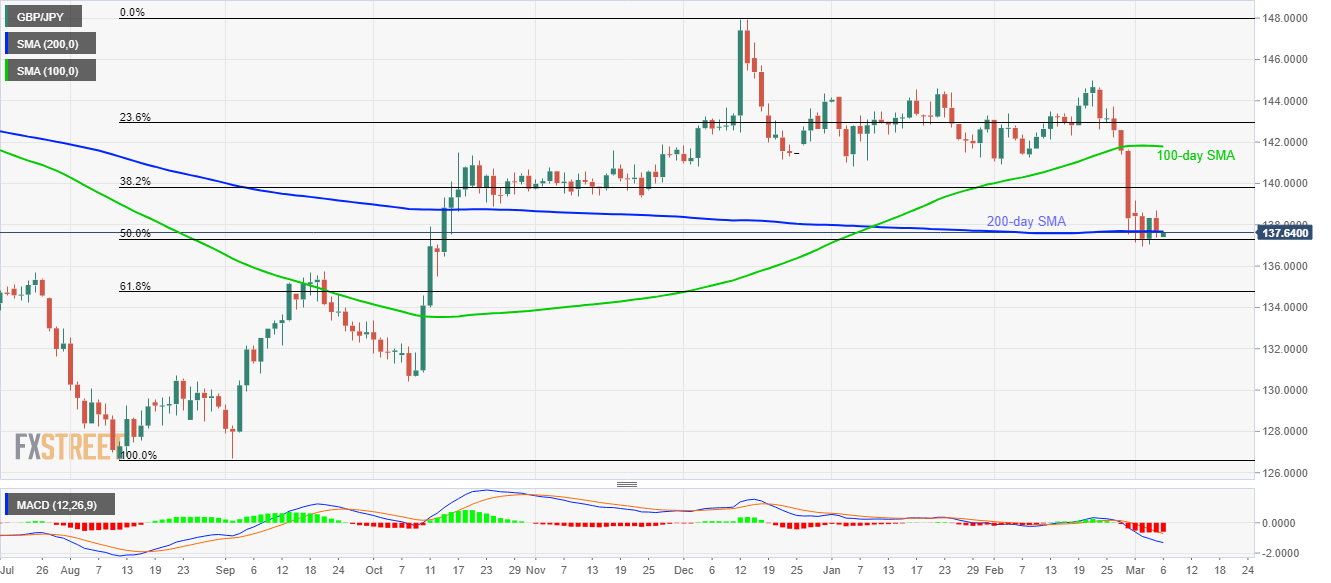
Trend: Sideways to bearish
