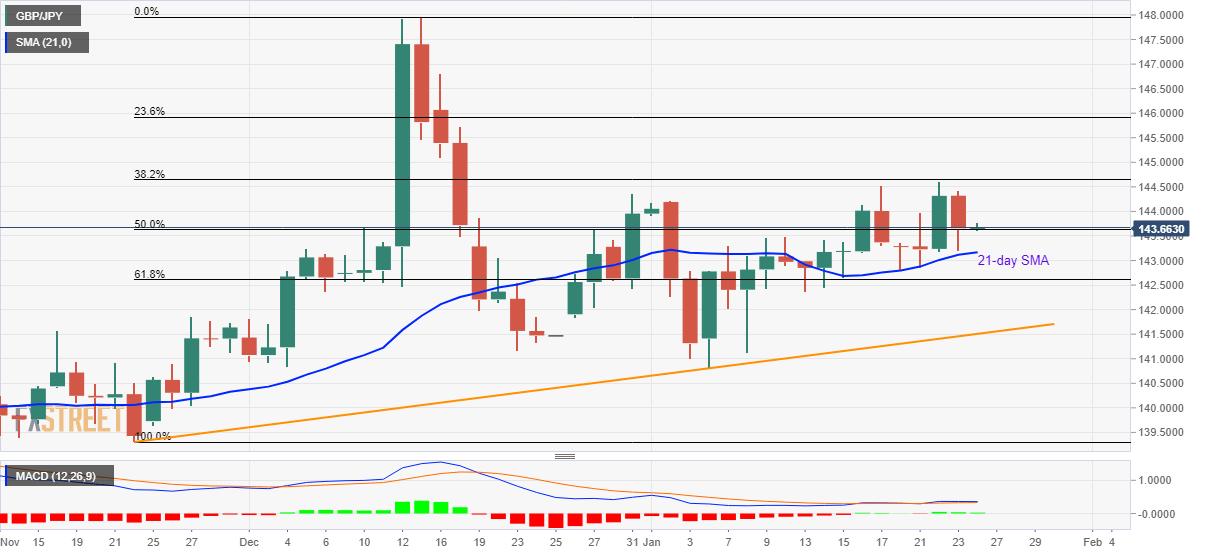
- GBP/JPY repeated fails to clear 38.2% Fibonacci retracement, stays above 21-day SMA since January 14.
- 61.8% Fibonacci retracement, the two-month-old rising trend line will lure sellers below the short-term moving average.
- Buyers will aim for December month high during the upside break.
GBP/JPY registers few moves while trading around 143.65 during Friday’s Asian session. On Thursday, the pair registered another pullback from 38.2% Fibonacci retracement of its run-up from November 22 to December 13. Even so, prices remain beyond 21-day SMA.
Considering the pair’s gradual recovery since January 06, coupled with mildly bullish MACD signals, buyers should hold their positions while targeting the 38.2% Fibonacci retracement level of 144.65.
A daily closing beyond 144.65 will quickly flash 145.00 on the chart whereas 23.6% Fibonacci retracement level and December month’s high, near 144.90 and 148.00 respectively, could lure the bulls afterward.
Meanwhile, 61.8% Fibonacci retracement level of 142.60 can limit the pair’s declines below 21-day SMA, at 143.17 now.
During the quote’s additional weakness past-142.60, an ascending trend line from November 22, at 141.50, will be the key to watch.
GBP/JPY daily chart
Trend: Further recovery expected
