- GBP/JPY stays mildly offered near the intraday low after Tuesday’s heavy losses.
- 100/200-day SMA confluence offers immediate resistance ahead of the ascending trend line from September 23.
- 61.8% Fibonacci retracement lures the bears amid normal RSI conditions.
GBP/JPY drops to 136.26, down 0.15% intraday, during the initial hours of Tokyo open on Wednesday. In doing so, the pair stretches the previous day’s downside break of a short-term support line, now resistance, below the key SMA joint.
With the RSI not near the overbought/oversold conditions, the continuation of a current downside can’t be ruled out. As a result, the 61.8% Fibonacci retracement of June-September upside near 135.95 gains the market’s attention as nearby support.
In a case where the GBP/JPY sellers dominate past-135.95, the monthly low of 135.05 and the July 14 bottom surrounding 134.00 should return to the charts.
Alternatively, an upside clearance of 136.50/55 immediate resistance, marked by the joint of 100-day and 200-day SMAs, will propel the quote towards the previous support line and 50% Fibonacci retracement level around 137.25/30.
Also acting as the key upside barrier will be a 50-day SMA level of 137.76 that holds the key to GBP/JPY rise towards the late-August low near 138.25.
GBP/JPY daily chart
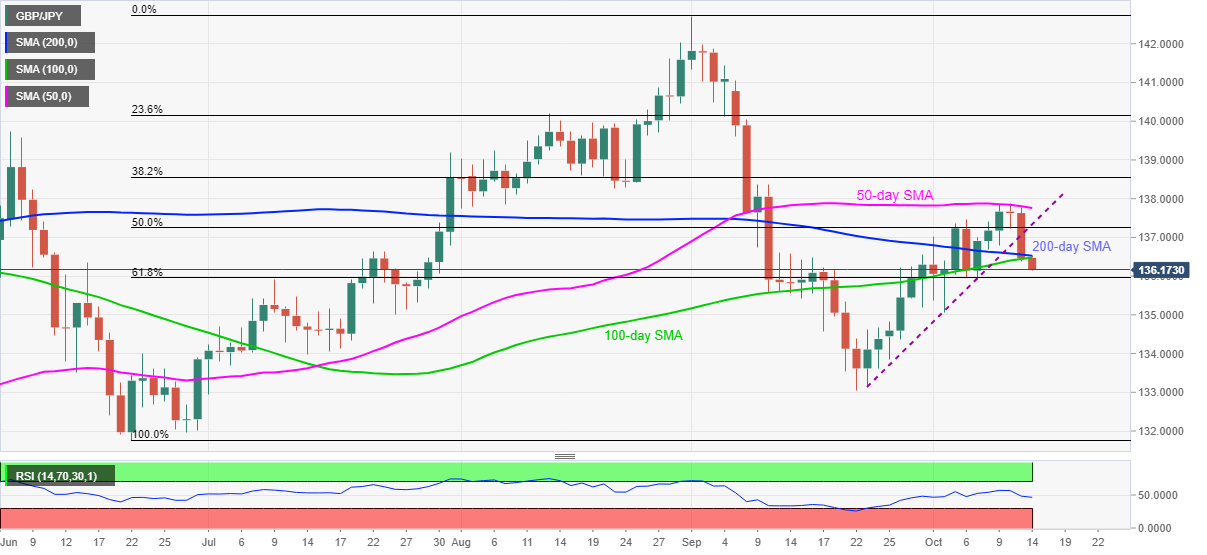
Trend: Bearish
