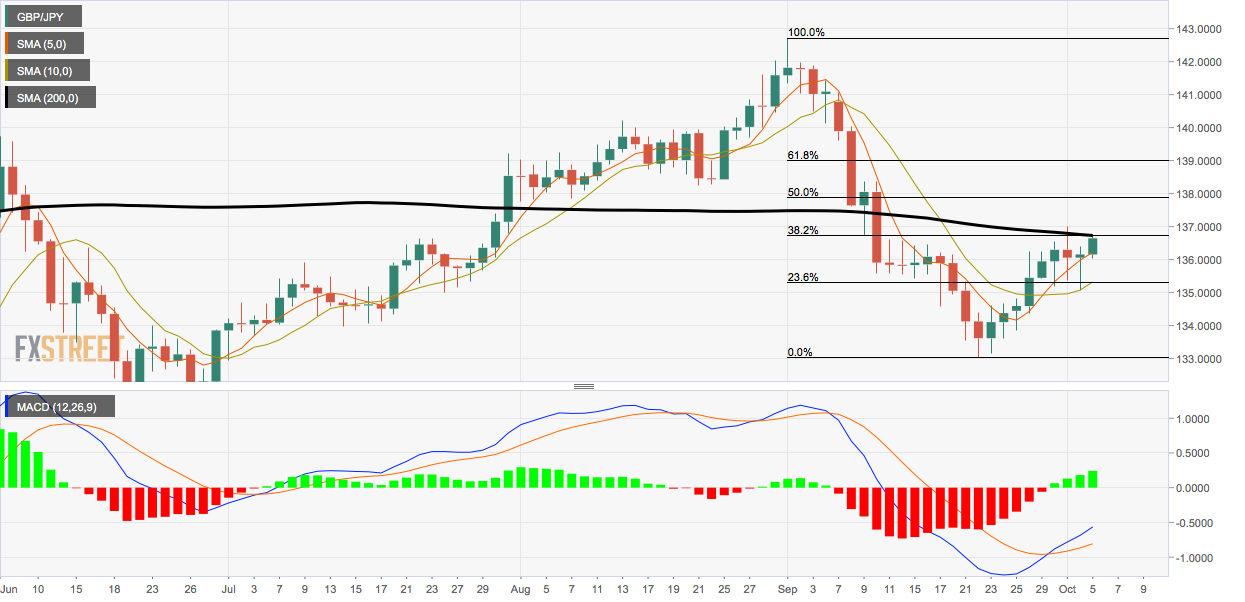
- GBP/JPY runs into confluence of a Fibonacci and 200-day SMA hurdles.
- A close higher could invite more substantial chart-driven buying.
GBP/JPY proved resistance at 136.73 a few minutes before press time. That level is the 38.2% Fibonacci retracement of the sell-off from the Sept. 1 high of 142.72 to the Sept. 22 low of 133.04.
Notably, the 200-day simple moving average (SMA) is located at 136.68 – just below the critical Fibonacci retracement.
A close above these levels would validate the daily chart MACD histogram’s bullish or above-zero reading, the ascending 5- and 10-day SMAs, and could fuel a stronger rise to 138.25 (Aug. 21 low).
Bulls, however, failed to keep gains above the 38.2% Fibonacci retracement on Oct. 1. Another failure will likely see the market re-test dip demand by revisiting the 10-day SMA at 135.23.
Daily chart
Trend: bullish above 136.73
Technical levels

