- GBP/JPY fails to keep bounce off intraday low.
- Key HMAs, weekly support line add to the downside filter.
- Bulls have fewer hurdles before reaching the 154.00 threshold.
- Normal RSI conditions, sustained trading beyond key supports favor buyers.
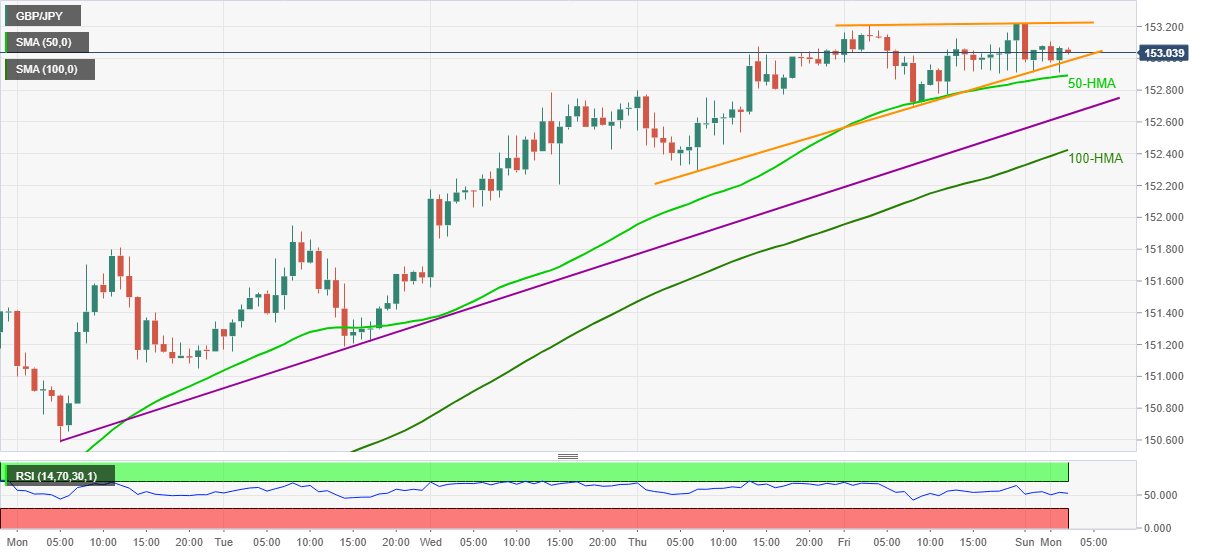
GBP/JPY fades pullback from intraday low while easing to 153.05 during early Monday. In doing so, the quote drops 0.10% while staying inside a two-day-old ascending triangle bearish formation.
Even if the pair’s failures to hold the latest recovery and a bearish chart pattern keep GBP/JPY sellers hopeful, strong supports stand tall to test the bears.
Among them, 50-HMA and an ascending trend line from March 29, respectively around 152.90 and 152.65, are the initial challenges for the pair’s further declines. 100-HMA level of 152.42 also acts as a downside filter.
Should the quote stays offered below 100-HMA, highs marked during March 29-30 near 151.80 will be in the spotlight.
Meanwhile, an upside clearance of the stated triangle’s resistance line, near 153.25, will propel the GBP/JPY prices towards the April 2018 high of 153.85.
If at all GBP/JPY buyers remain dominant past-153.85, the 154.00 will become their favorites.
GBP/JPY hourly chart
Trend: Pullback expected
