GBP/JPY has crossed above 151 for the first time since April 2018. The pair has gained over 7% this year.
While the 14-day Relative Strength Index (RSI) is signaling overbought conditions with an above-70 print, the daily price chart is showing no signs of bull fatigue. As such, the outlook remains bullish.
However, the 5-minute chart shows a bearish divergence of the RSI. Further, the current hourly candle is carrying a long upper wick, a sign of rejection of higher prices.
As such, the pair may pull back to the hourly chart former hurdle-turned-support at 150.73.
Hourly chart
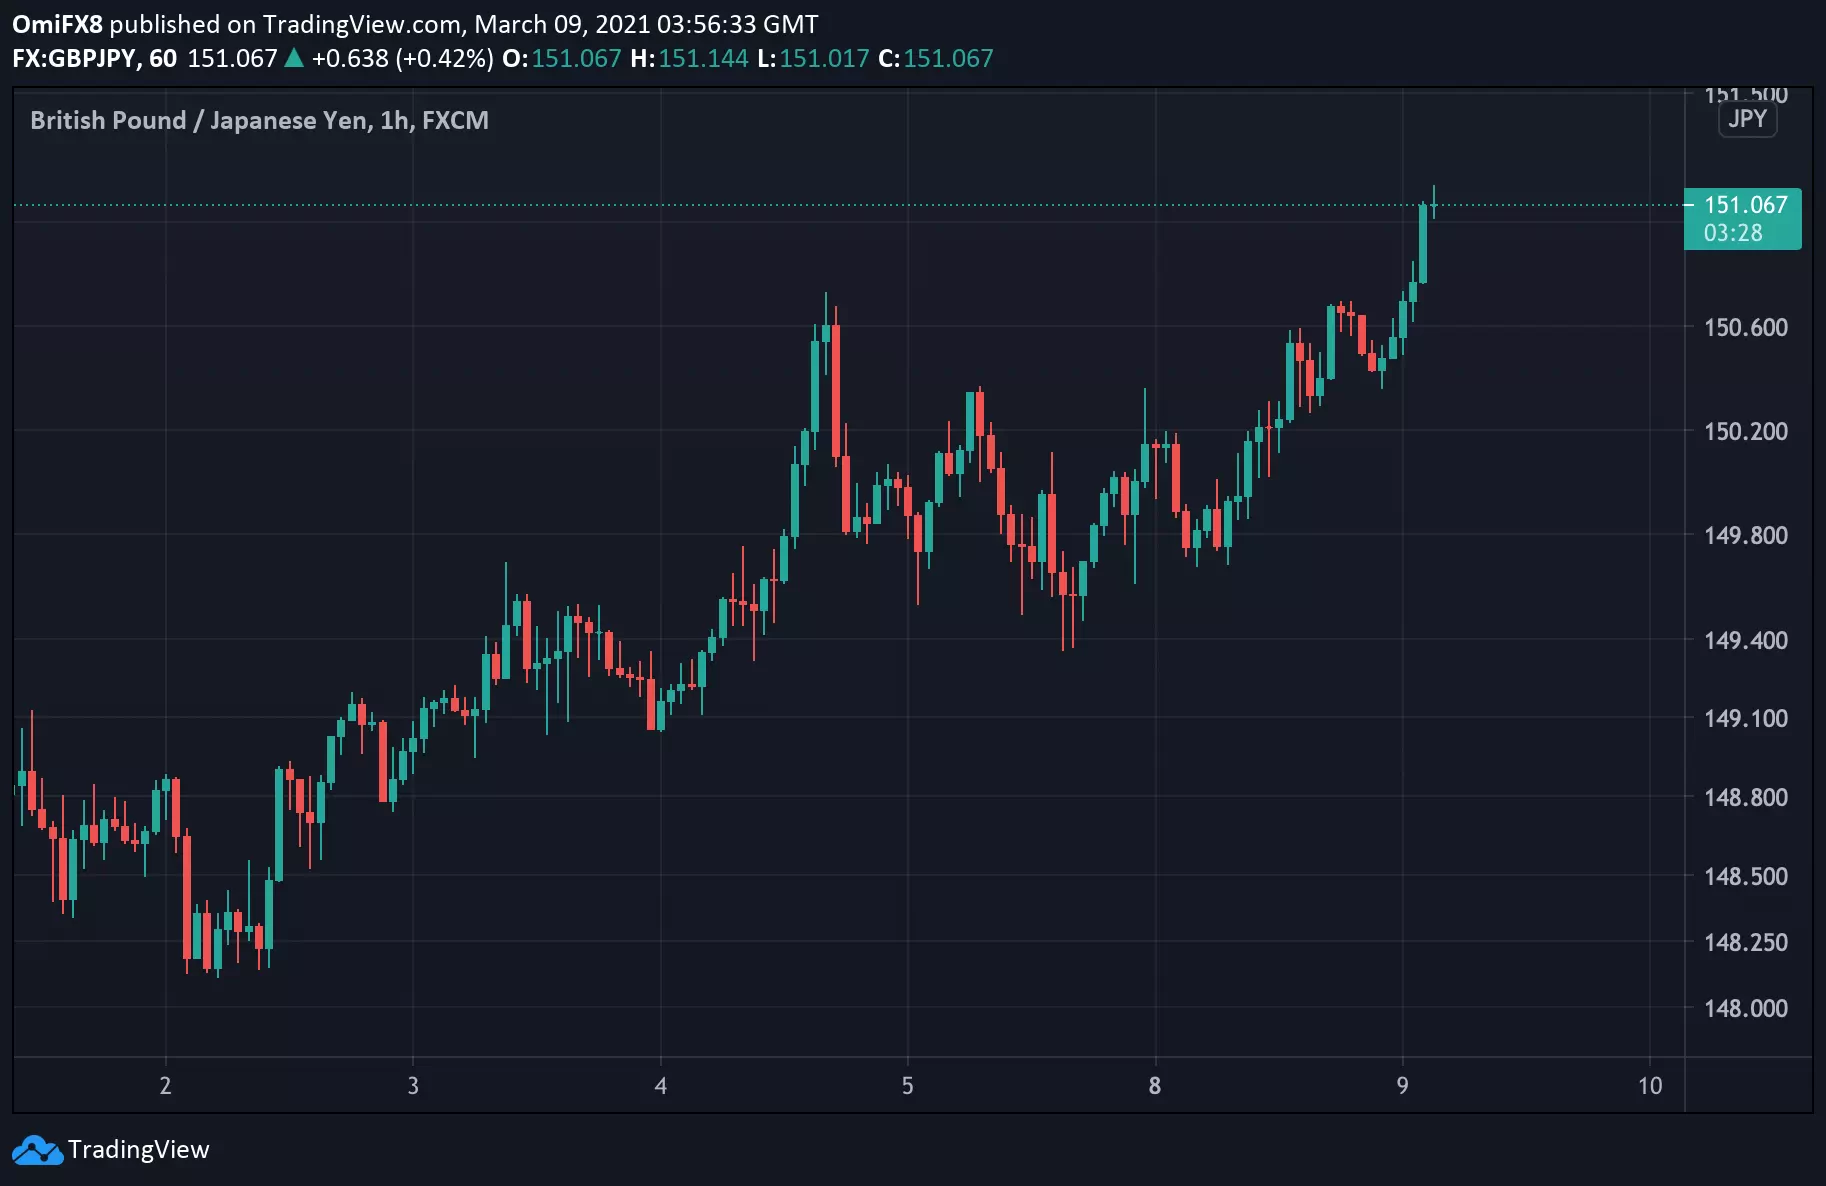
Trend: Bullish
Technical levels
