- GBP/JPY overall downward bias remains intact, although the currency cross had a bounce from recent lows.
- GBP/JPY is trading off the 132.29 resistance and 100 SMA in the four-hour chart.
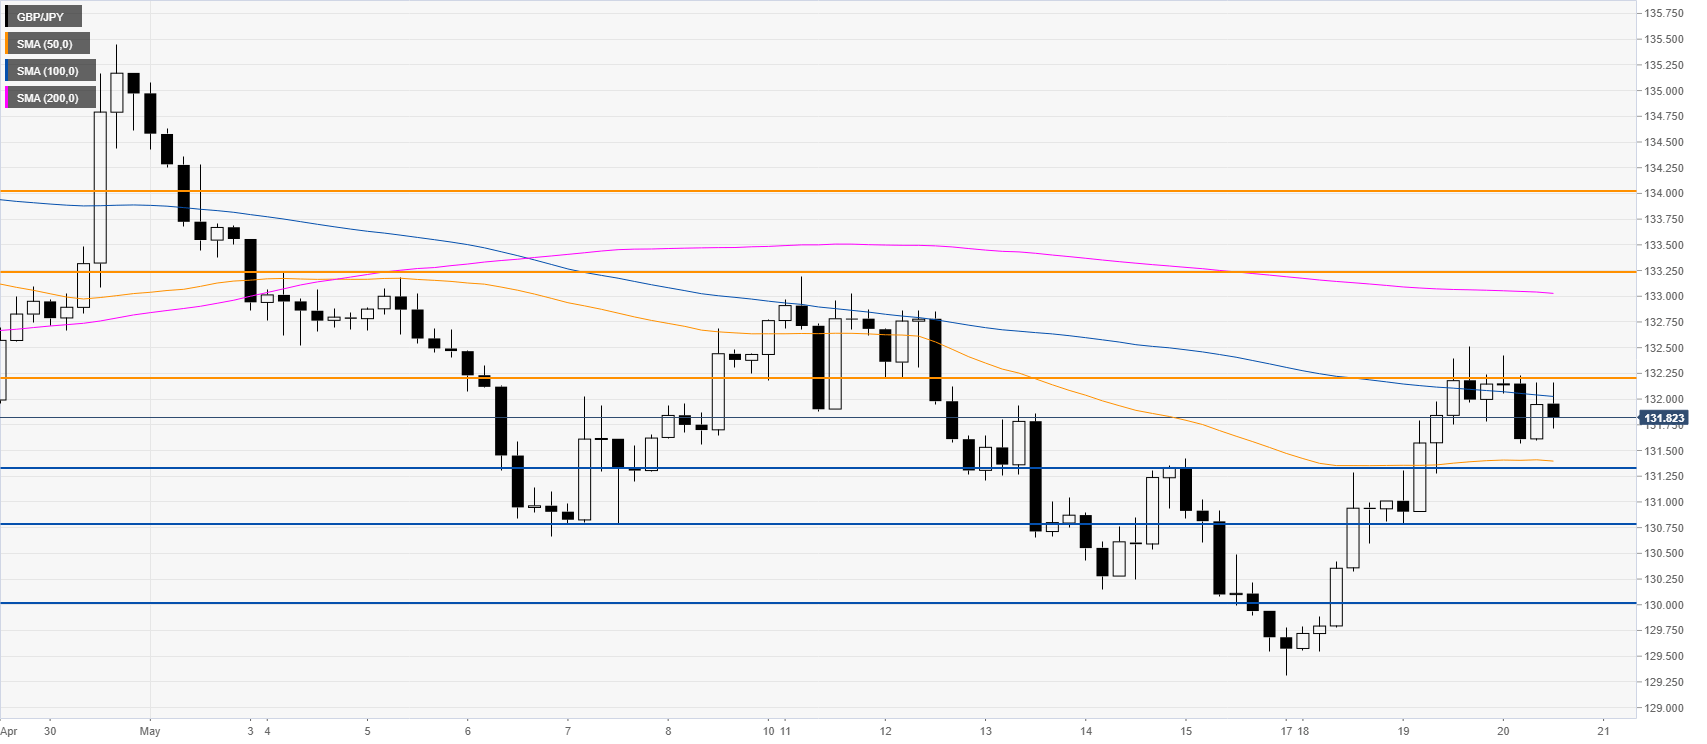
GBP/JPY four-hour chart
GBP/JPY is trading below the 100 and 200 SMA on the four-hour chart while making lower lows and lower highs, suggesting a bearish bias in the medium-term. The currency cross is consolidating a rebound below the 132.29 resistance and the 100 SMA. As the overall downward bias remains intact, bears should remain in control below the mentioned level with a potential decline towards the 131.46, 130.80 and 130.00 levels. On the flip side, resistances are seen near 132.29, 133.25 and 134.00 price levels.
Resistance: 132.29, 133.25, 134.00
Support: 131.46, 130.80, 130.00
Additional key levels
