- GBP/JPY bears catch a breather after posting the biggest losses in a month.
- Failure to cross 200-bar SMA, bearish chart pattern suggest further downside.
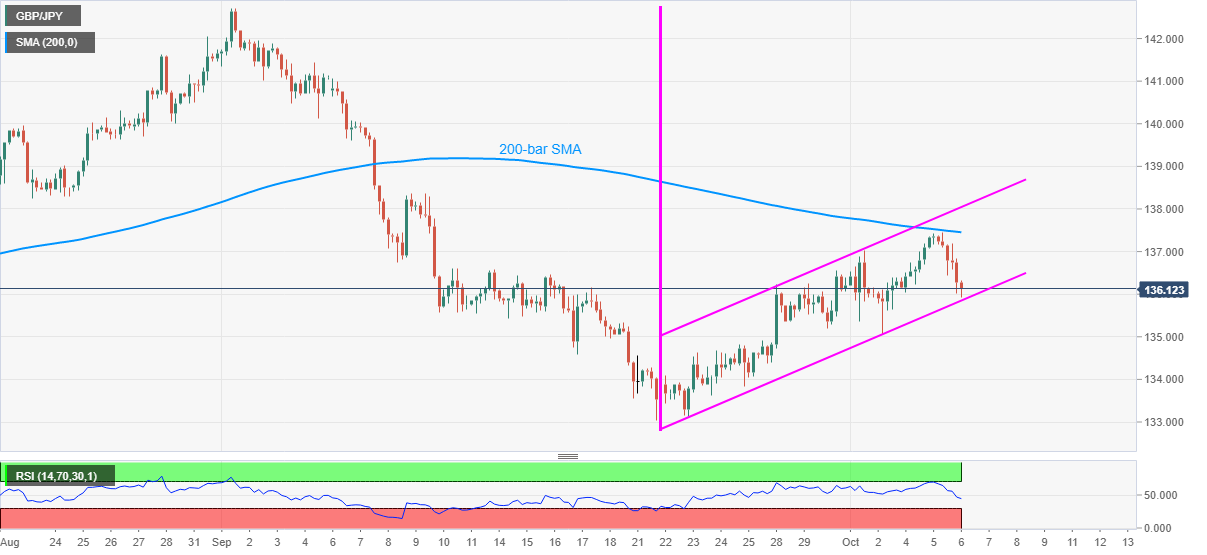
- Flag’s resistance line adds to the upside barriers for the bulls.
GBP/JPY struggles to keep the bounces off 135.90 intraday low while taking rounds to 136.00 during the pre-Tokyo open Asian session on Wednesday. In doing so, the Pound cross teases the support line of a bear flag formation amid downward sloping RSI.
Also increasing odds for the pair’s further downside is the clear U-turn from 200-bar SMA.
However, the further selling should wait for 135.85, comprising the lower line of the flag, a break of which could confirm the bearish chart play and drag GBP/JPY prices towards the September month’s low near 133.85.
In a case where the quote remains downbeat below 133.85, as it should on the theoretical basis, the September 22 low near 133.00 and June month’s bottom surrounding 131.75 could gain market attention.
Meanwhile, the 137.00 round-figures and 200-bar SMA level of 137.45 can offer immediate resistance to GBP/JPY ahead of highlighting the flag’s upper line, at 138.05 now.
Should the pair buyers manage to cross 138.05, the September 09 peak close to 139.10 offers an extra hurdle during the north-run to the 140.00 round-figure.
GBP/JPY four-hour chart
Trend: Bearish
