- GBP/JPY probes intraday high while snapping two-day declines after reversing from the weekly low.
- Bullish MACD, bounce off the key HMA favor further recoveries.
- Important Fibonacci retracement levels add to the downside filters.
GBP/JPY takes the bids near 141.10, up 0.06% on a day, amid the initial Friday’s trading. The pound cross recently took a U-turn from 200-HMA while choosing not to follow the previous declines in the last two days. In doing so, the quote also flashes bullish MACD as it recovers from the weekly low.
Hence, buyers are targeting a falling trend line from Tuesday, near 141.25, as an immediate upside barrier ahead of 142.00 and the monthly high around 142.70.
Should the pair manages to remain strong past-142.70, it can very well challenge the yearly peak surrounding 145.00. Though, 143.40 and 144.60 may offer intermediate halts during the rally.
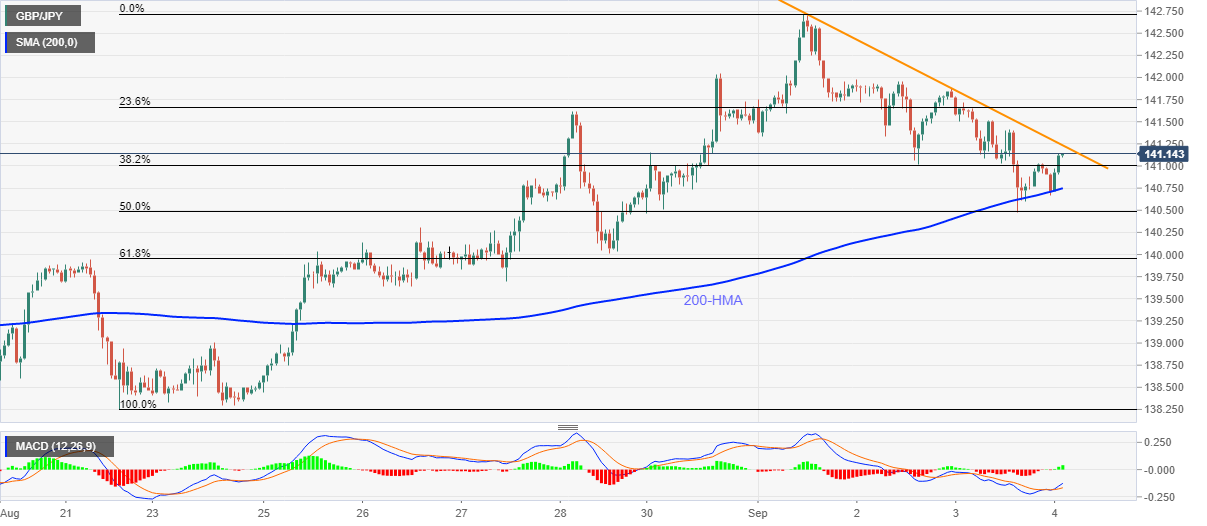
On the flip side, a clear break below the 200-HMA level of 140.74 will aim for 50% and 61.8% Fibonacci retracement of the pair’s upside from August 21 to September 01, respectively around 140.50 and 139.95.
GBP/JPY hourly chart
Trend: Further recovery expected
