- GBP/JPY drops to the four-day low while extending pullback from 50-day SMA.
- Lows marked from December 2019 can offer intermediate halt towards 100-day SMA.
- Bearing MACD, lower highs favor sellers.
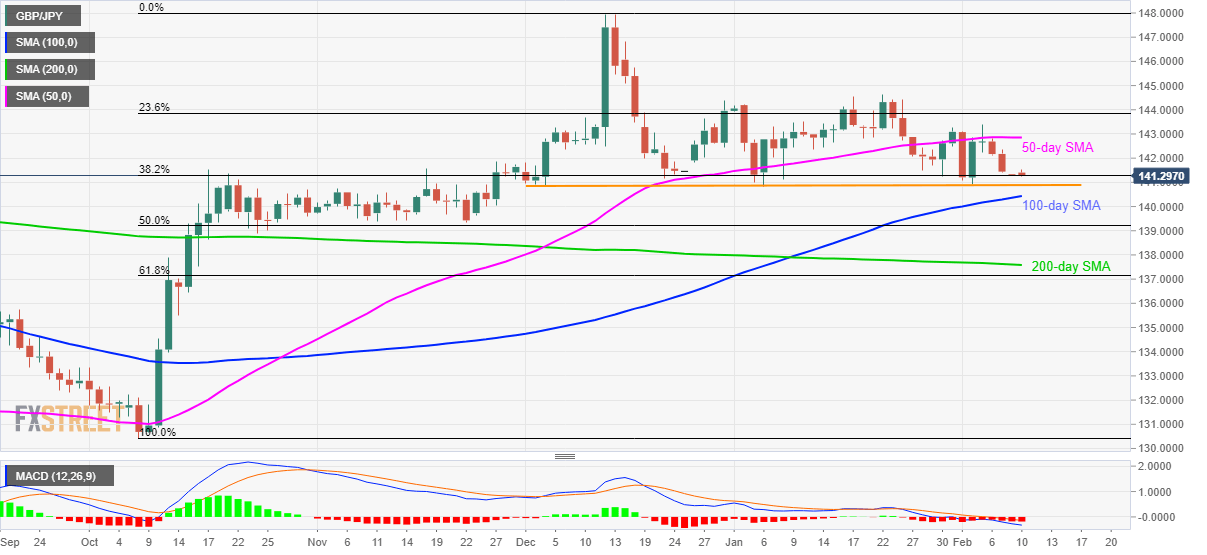
GB/JPY declines to 141.30 during the Asian session on Monday. The pair recently reversed from 50-day SMA and is currently testing 38.2% Fibonacci retracement of its October-December 2019 upside.
Not only the pair’s inability to cross 50-day SMA but the bearish MACD signals also push sellers towards horizontal support that connects the lows marked since December 04, 2019, around 140.85/80.
In a case where the pair fails to bounce off 140.80, a 100-day SMA level of 140.45 and 140.00 round-figure could return to the charts.
Meanwhile, the pair’s break beyond 50-day SMA level of 142.85 will have to cross 23.6% of Fibonacci retracement, at 143.85, to challenge the yearly top surrounding 144.60.
GBP/JPY daily chart
Trend: Bearish
