- GBP/JPY fails to hold onto recovery gains.
- A descending trend line since December 13 offers immediate resistance.
- Pair’s declines below the 11-week-old support line could please the bears.
GBP/JPY trades near 142.80 during Monday’s Asian session. In doing so, the pair snaps the previous two-day winning streak while nearing 50-day SMA and 23.6% Fibonacci retracement of its September-December 2019 upside.
Considering the failure to keep the gains, as well as nearness to the key resistance line ranging from early-December 2019, prices may witness further downside if closing below 50-day SMA level of 142.80.
With that, the sellers could aim for an ascending trend line since November 16, at 141.40 now, during further downside.
However, pair’s south-run under 141.40 becomes the key as it will recall 140.00 round-figure on the chart.
Meanwhile, pair’s daily closing beyond the immediate resistance line, currently near 143.60, will challenge the previous month’s top near 144.60 while targeting 145.50.
It should also be noted that the pair’s rise beyond 145.50 enables it to target December 2019 high of 147.93.
GBP/JPY daily chart
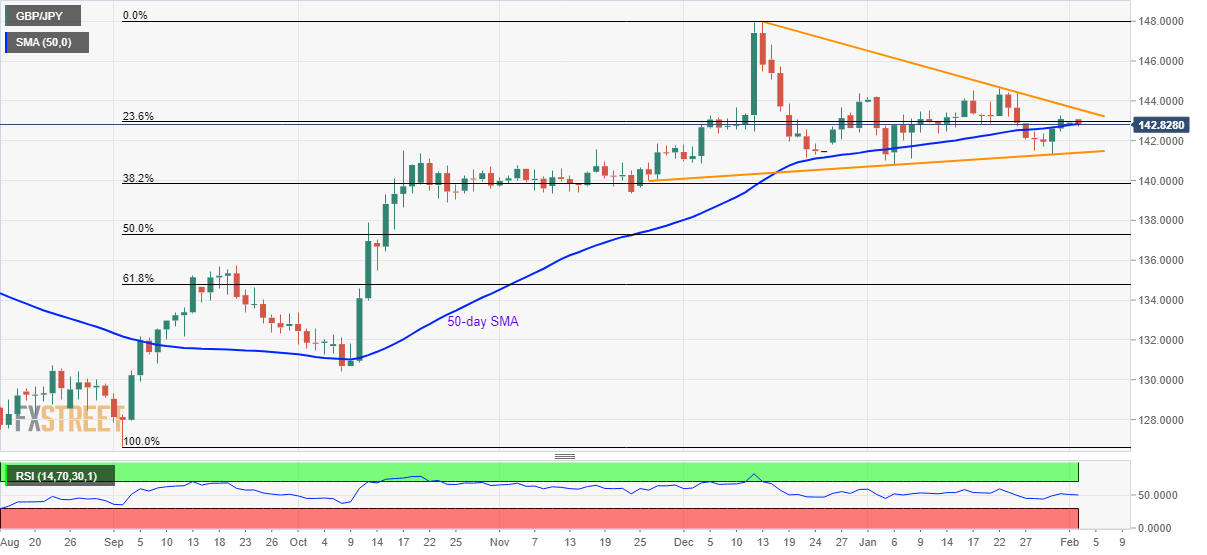
Trend: Sideways
