- GBP/JPY recovers from the intra-day low, extends bounces off 23.6% Fibonacci retracement of October-December 2020 upside.
- Prices remain above 200-day EMA since mid-October 2019.
- An upside break of ascending trend line from December 31, 2019, can challenge October 2019 top.
GBP/JPY bounces off the intra-day low of 144.07 to 144.50 by the press time of early Monday.
The pair recently crossed 23.6% Fibonacci retracement but fails to gain momentum beyond short-term resistance-line. However, RSI remains in the normal territory and favors further upside of the quote.
That said, buyers will look for entry beyond the aforementioned resistance line, at 145.00 now, a break of which could aim for December 13, 2019 low near 145.50.
Though, the pair’s sustained run-up beyond 145.50 might not refrain to challenge the late-2019 top close to 148.00.
On the downside, pair’s declines below 23.6% Fibonacci retracement, at 143.80, could trigger fresh pullback towards February 05 high around 143.40 as well as 38.2% Fibonacci retracement level of 141.23.
It should, however, be noted that the quote’s declines below 38.2% Fibonacci retracement will be challenged by a 200-day EMA level of 140.34 and 140.00 round-figure.
GBP/JPY daily chart
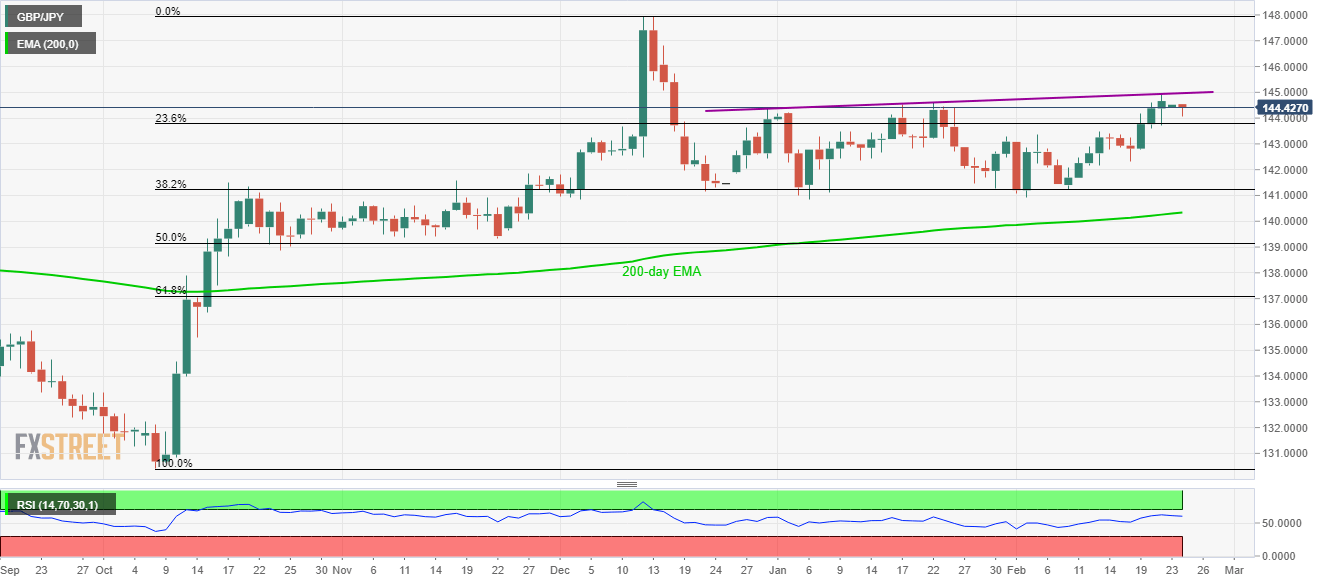
Trend: Bullish
