- Oversold RSI triggered the latest pullback, 21-HMA offers immediate support.
- An upside break of 2-week old resistance-area highlights 50-HMA and late-June lows.
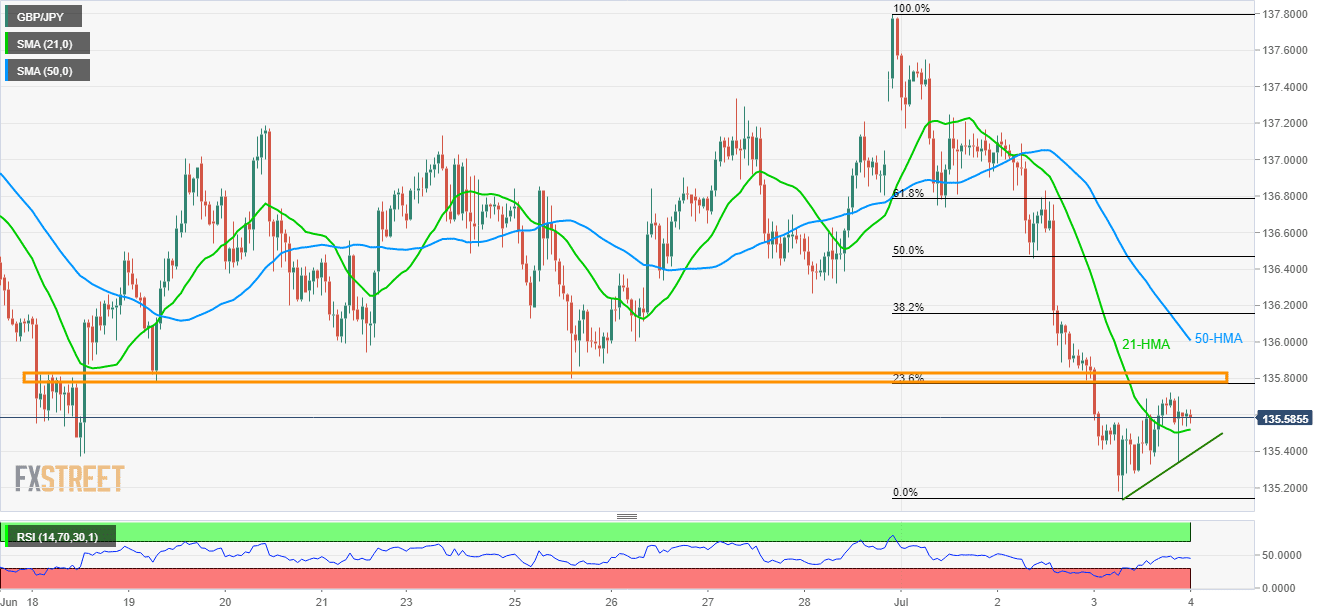
Even after bouncing off the 6-month low, the GBP/JPY pair isn’t immune to further downside considering its present state of trading around 135.90 amid Thursday morning in Asia.
The reason being a fortnight-long horizontal region that has been limiting the pair’s upside since mid-June around 135.77/82, also comprising 23.6% Fibonacci retracement of the latest downpour.
As a result, sellers seek the breakdown of 21-hour moving average (21-HMA) at 135.52 and an immediate ascending trend-line near 135.38 to aim for latest low surrounding 135.15.
In a case where prices keep declining past-135.15, the current year low and late-September 2016 high around 132.40 should flash on the bear’s radar.
Meanwhile, pair’s ability to cross 135.82 resistance on the back of the 14-bar relative strength index (RSI) recovery highlights 50-HMA and late-June lows, 136.00 and 136.27 respectively, for buyers to watch.
GBP/JPY hourly chart
Trend: Bearish
