- A failure to sustain the pullback signals weakness of the quote.
- Near-term support-line and RSI levels could limit further declines.
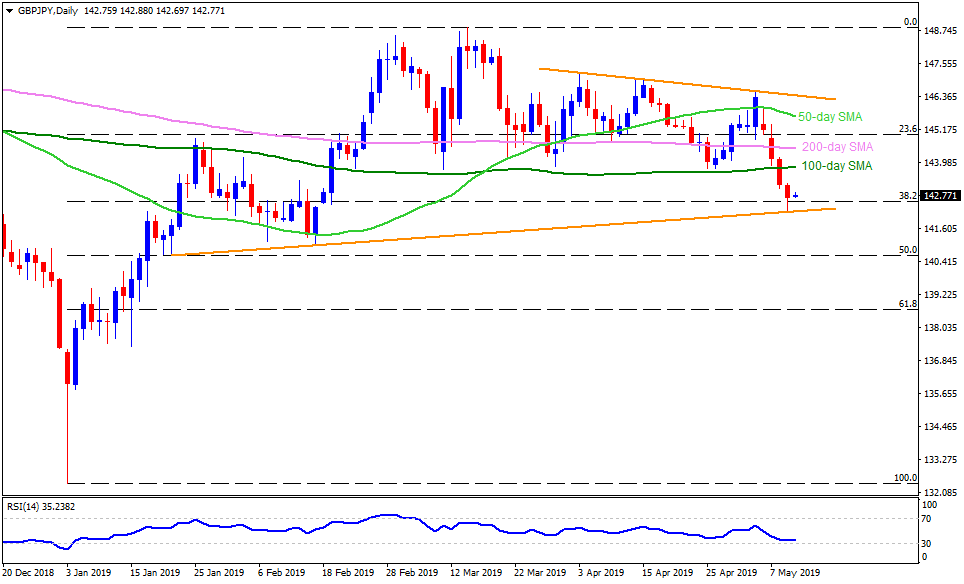
Despite bouncing off an upward sloping support-line stretched since late-January, the GBP/JPY still remains weak as it trades near 142.75 during early Friday.
The quote couldn’t respect the refrain from declining beneath 15-week old ascending trend-line at 142.20 now, while the 14-day relative strength index (RSI) remains close to oversold territory.
As a result, chances of the pair’s 142.20 re-test seem brighter while its further declines can be challenged by the RSI, if not then February low near 141.00 can offer an intermediate halt during the downturn to 50.00% Fibonacci retracement of its January – March rise at 140.60.
It should also be noted that an additional downside under 140.60 may avail 140.00 round-figure as a validation to its drop towards 61.8% Fibonacci retracement level of 138.70.
On the upside, 143.25, 100-day simple moving average (SMA) level of 143.80 and 144.50 comprising 200-day SMA could entertain short-term buyers.
However, 145.00, 50-day SMA at 145.65 and a month-long descending trend-line at 146.40 could challenge the bulls past-144.50.
GBP/JPY daily chart
Trend: Bearish
