- Failure to cross 50-day SMA highlights 200-day SMA as important support.
- A month-old trend-line adds into the upside resistances.
Following its pullback from 50-day SMA, GBP/JPY is on the rounds near 145.15 during early Tuesday.
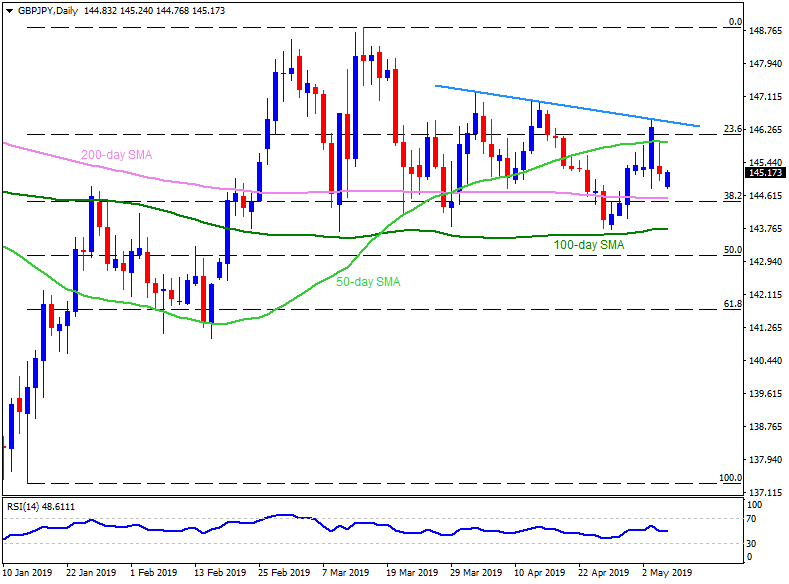
Given the quote manage to extend the latest U-turn, 145.70 can act as nearby resistance ahead of driving buyers to aim for 145.95 – 146.00 area including 50-day SMA.
However, a five-week long descending trend-line at 146.50 may limit further advances past-146.00, if not then 147.00 could lure the bulls.
On the flipside, the 144.55/45 region comprising 200-day simple moving average (SMA) and 38.2% Fibonacci retracement of its mid-January to March 14 upside seems immediate support for sellers to watch.
If at all prices slip under 144.45, 100-day SMA level of 143.80 and 143.25 can play their role of support.
GBP/JPY daily chart
Trend: Pullback expected
