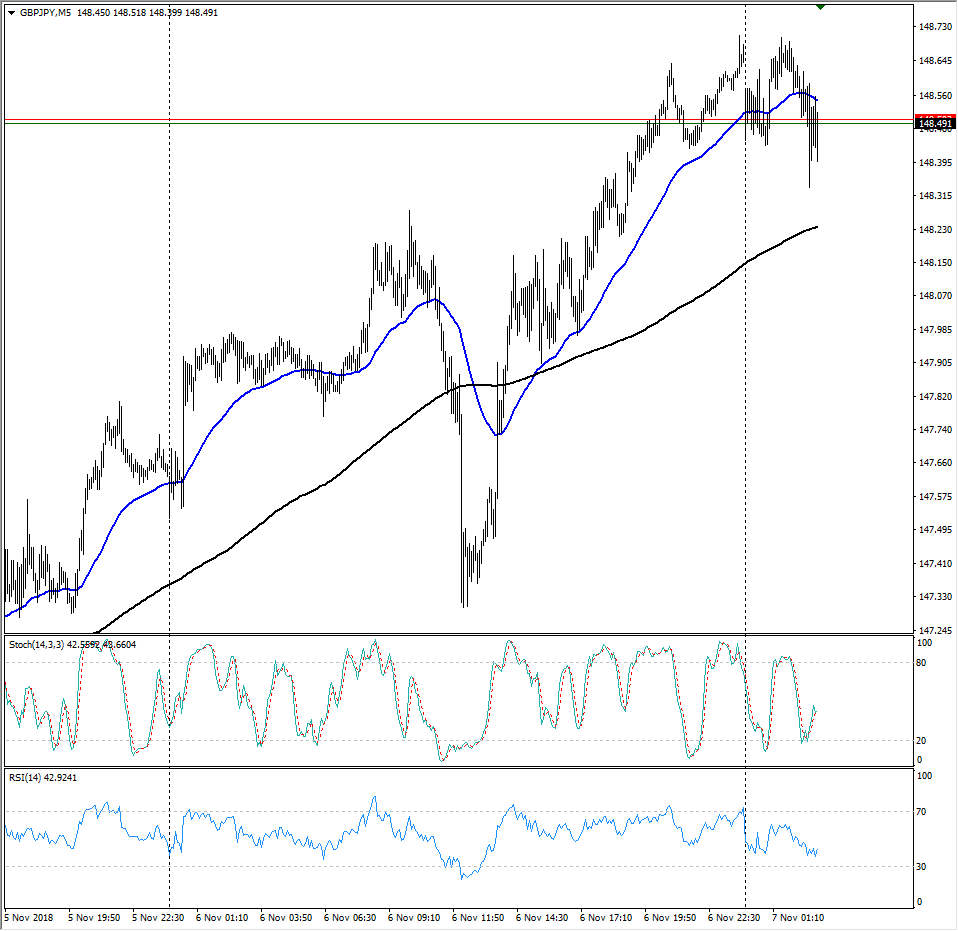
- The GBP/JPY has seen an overall bullish stance over the past twenty-four hours, but downside shocks continue to spread throughout the intraday sessions.
GBP/JPY M5
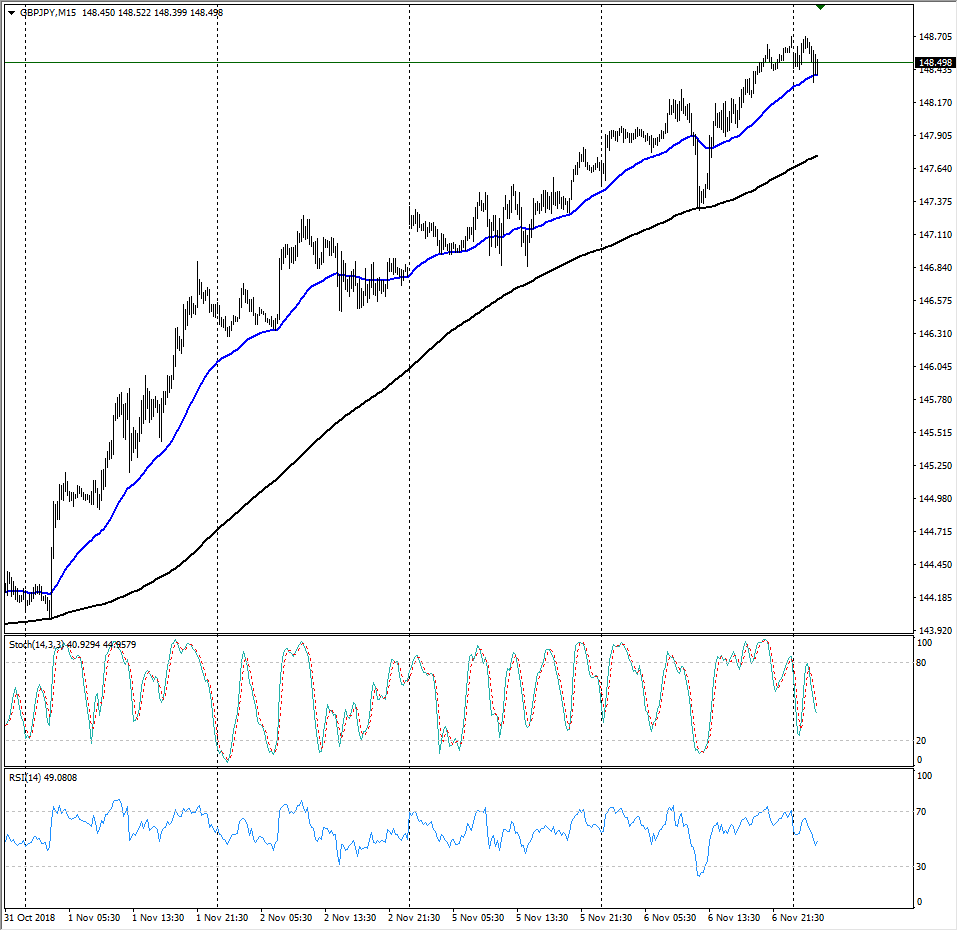
- Looking further out, the Guppy remains well-bid off of bounces from the 50-period moving average on 15-Minute candles, currently sitting at 148.40, and early Wednesday action is testing the near-term support level.
GBP/JPY M15
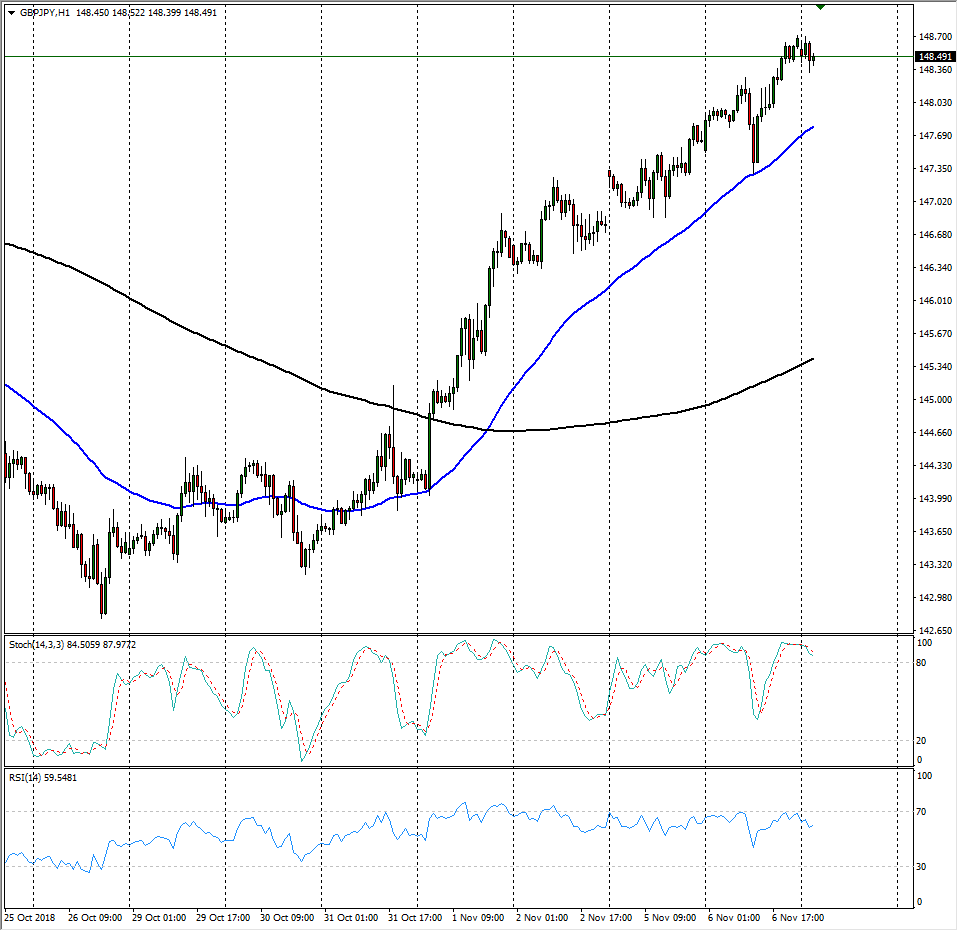
- On hourly candles, the GBP/JPY sees firm support from the 50-hour moving average, with the 200-hour moving average sitting far below at 145.40.
GBP/JPY H1
GBP/JPY
Overview:
Last Price: 148.45
Daily change: -16 pips
Daily change: -0.108%
Daily Open: 148.61
Trends:
Daily SMA20: 146.3
Daily SMA50: 146.49
Daily SMA100: 145.72
Daily SMA200: 147.48
Levels:
Daily High: 148.65
Daily Low: 147.3
Weekly High: 147.26
Weekly Low: 143.22
Monthly High: 149.52
Monthly Low: 142.78
Daily Fibonacci 38.2%: 148.13
Daily Fibonacci 61.8%: 147.82
Daily Pivot Point S1: 147.73
Daily Pivot Point S2: 146.85
Daily Pivot Point S3: 146.39
Daily Pivot Point R1: 149.07
Daily Pivot Point R2: 149.53
Daily Pivot Point R3: 150.41
