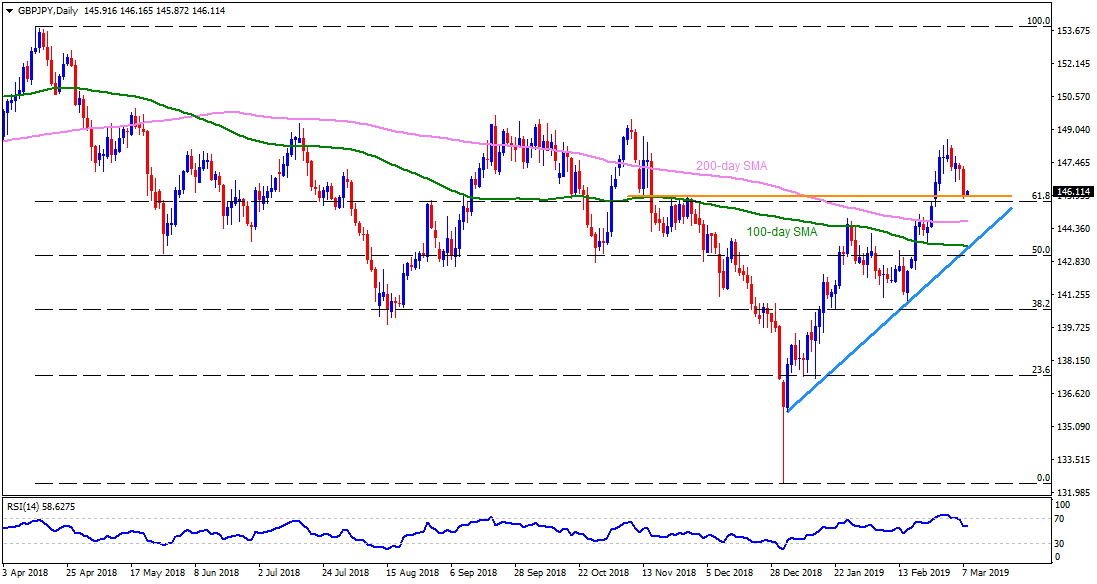
GBP/JPY daily chart
- GBP/JPY is taking the bids around 146.10 around Tokyo open on Friday.
- Pair recently bounced off 145.90-146.00 horizontal-support comprising low of November 13 and November 22 high, which in-turn signal brighter chances of its recovery towards 146.60 immediate resistance.
- Should the quote maintain its strength past-146.60, 147.25, 148.00 and 148.30 can come back on the chart.
- Meanwhile, a downside close beneath 145.90 can make the sellers target 200-day simple moving average (SMA) figure of 144.65.
- However, pair’s decline after 144.65 may find it hard to conquer 100-day SMA and an ascending support-line stretched since January 07, at 143.50.
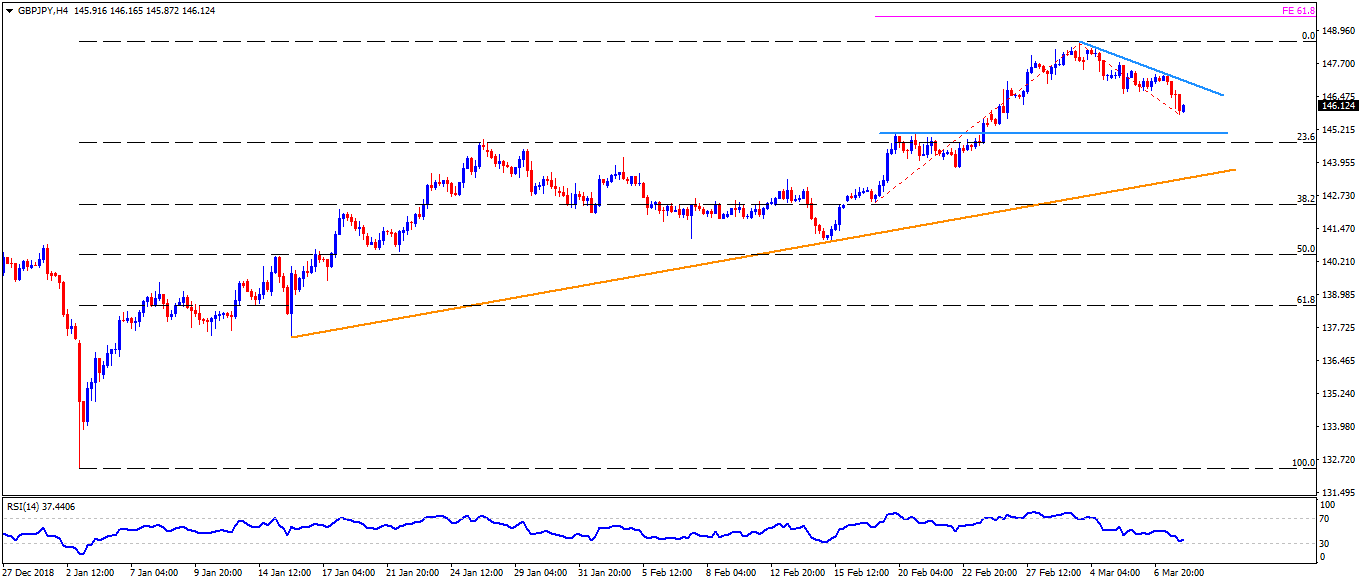
GBP/JPY 4-Hour chart
- An immediate descending trend-line at 147.00 can provide an intermediate halt between 146.60 and 147.25 whereas 148.55 and 61.8% Fibonacci expansion (FE) level of 149.55 can please buyers past-148.30.
- On the downside, 145.00 is likely a buffer after 145.90 breaks with an upward sloping trend-line at 143.30 expected to challenges sellers under 143.50.
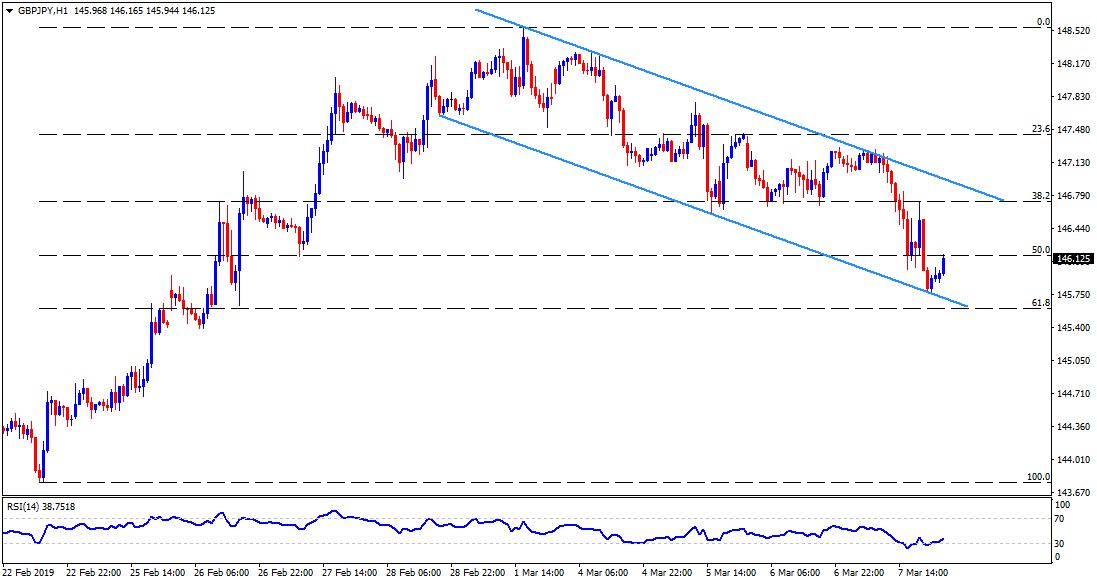
GBP/JPY hourly chart
- In addition to daily, the H1 chart also signifies the importance of recent bounce with short-term descending trend-channel.
- 145.40 can offer extra support between 145.90-145.00 whereas 147.65-70 could stop prices for a while after 147.25 towards 148.00.