- GBP/JPY trades near the three-day high after breaking near-term key resistances.
- While bulls aim to revisit early-month tops, bears will enter below the horizontal area including monthly lows.
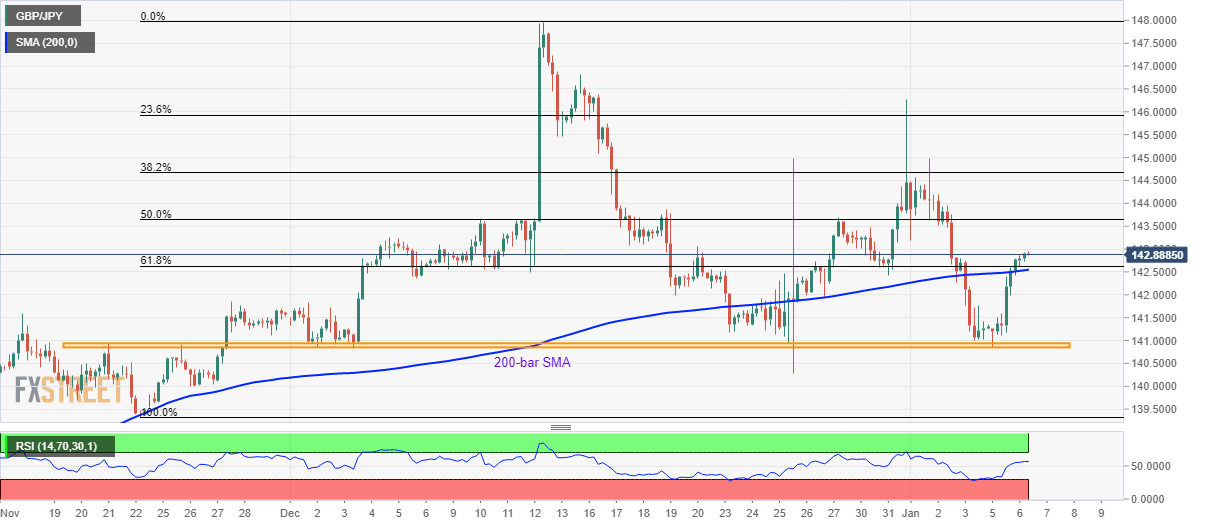
GBP/JPY takes the bids to 142.90 while heading into the UK open on Tuesday. The pair recently crossed 200-bar SMA and 61.8% Fibonacci retracement of November 22-December 13 upsides. As a result, the pair’s recent recovery is likely to get extended.
In doing so, the early-month tops surrounding 144.45/50 will be in the buyers’ immediate focus. A break of which could propel prices to December 16 top of 146.82 and then towards the previous month high surrounding 148.00.
During the quote’s further rise past-148.00, 148.90 and 150.00 will grab the Bull’s attention.
Meanwhile, sellers will look for entry below 140.93/85 area including multiple lows marked since early-December.
In that case, 140.00 round-figure and November month bottom close to 139.30 could return to the charts.
GBP/JPY four-hour chart
Trend: Bullish
