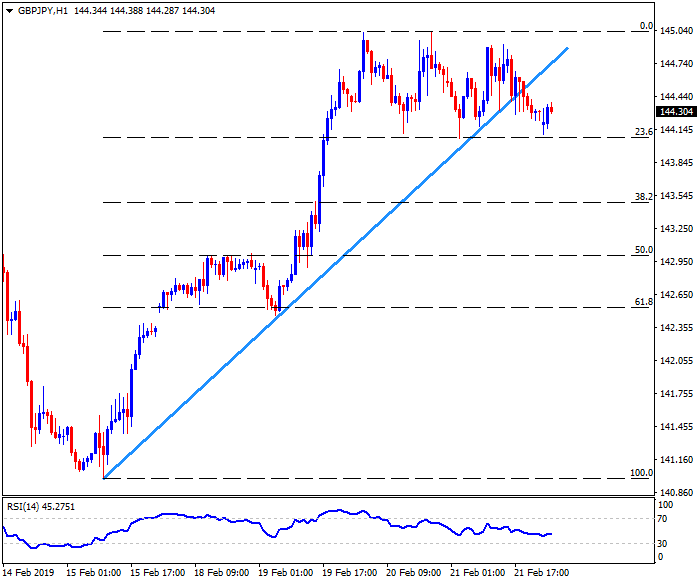
GBP/JPY daily chart
- GBP/JPY trades near 144.30 during early Asian sessions on Friday.
- The pair remains under 200-day simple moving average (SMA) after failing to clear the same twice during Wednesday and Thursday.
- While 143.55 can offer immediate rest, 61.8% Fibonacci retracement of its September 2018 to January 2019 decline, at 143.00, could become near-term important support for the pair.
- Should prices slide beneath 143.00 on a daily closing basis, 142.50 and an upward sloping support-line connecting recent lows, at 141.85, may grab the spotlight.
- On the upside clearance of 144.70 SMA figure could trigger the pair’s recovery towards 146.00 horizontal-resistance whereas 147.00 and 147.30 may challenge buyers then after.
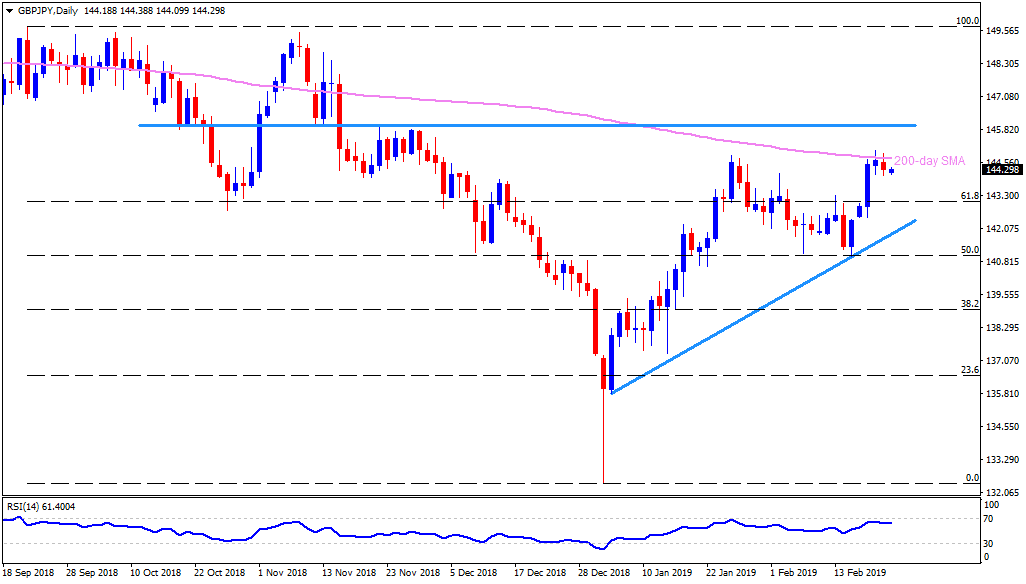
GBP/JPY 4-Hour chart
- In addition to falling short of crossing 200-day SMA, the pair recent slipped below a week old ascending support-line, which in-turn signal brighter chances of its further declines to 143.55 and then to 143.00.
- The pair needs to surpass 145.00 in order to visit 61.8% Fibonacci expansion of its recent moves, at 145.60.
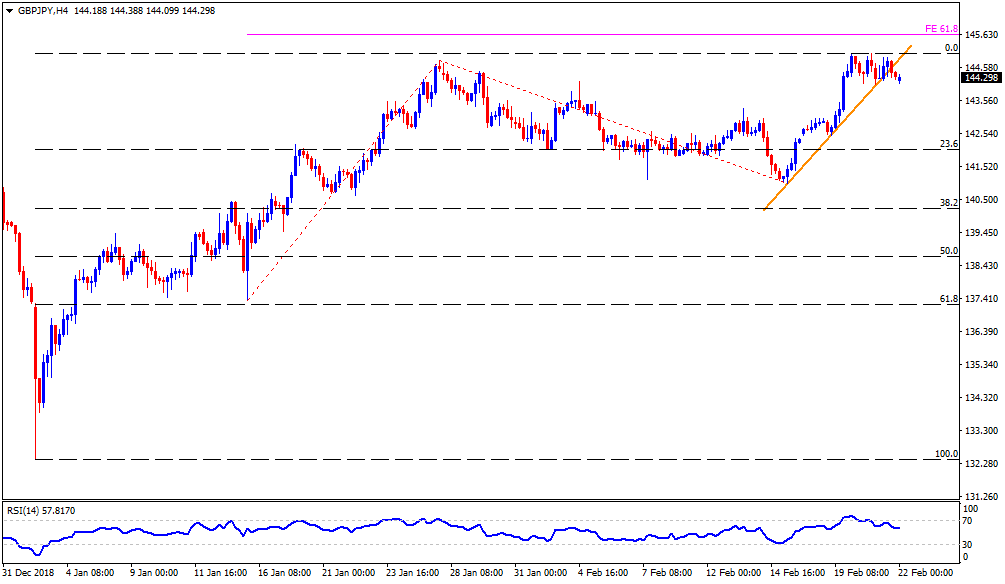
GBP/JPY hourly chart
- On the H1 chart, the 143.20 may offer intermediate halt past-143.55 towards 143.00 whereas 144.60 could act as nearby resistance ahead of highlighting 145.00 upside barrier.