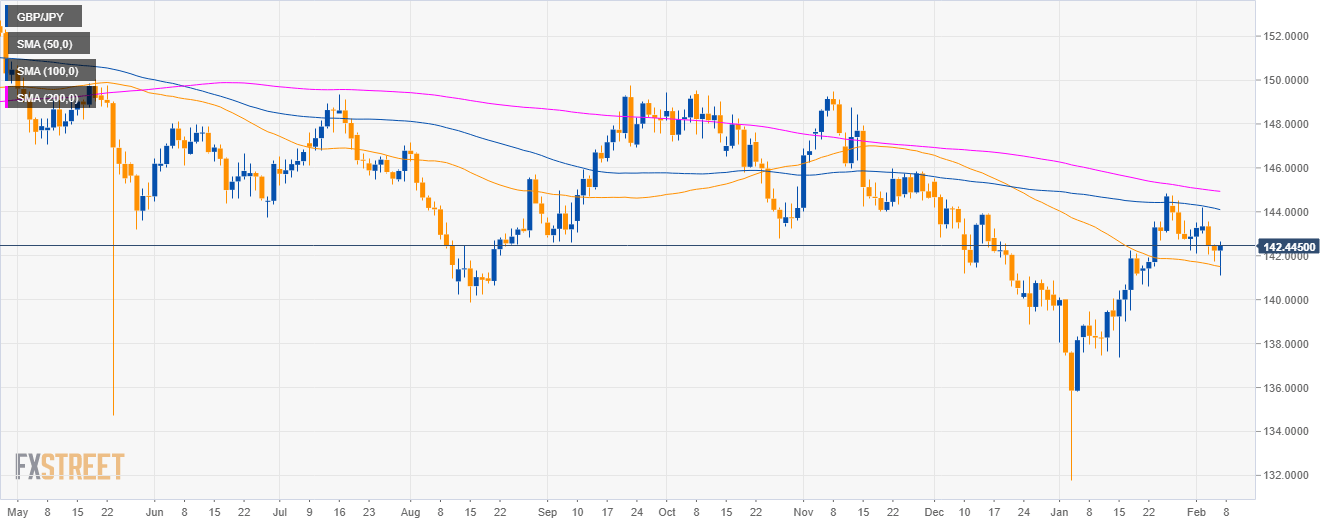
GBP/JPY daily chart
- GBP/JPY is trading in a bear trend below the 100 and 200-day simple moving averages (SMAs).
- The Bank of England Super Thursday provided lots of volatility for the Sterling.
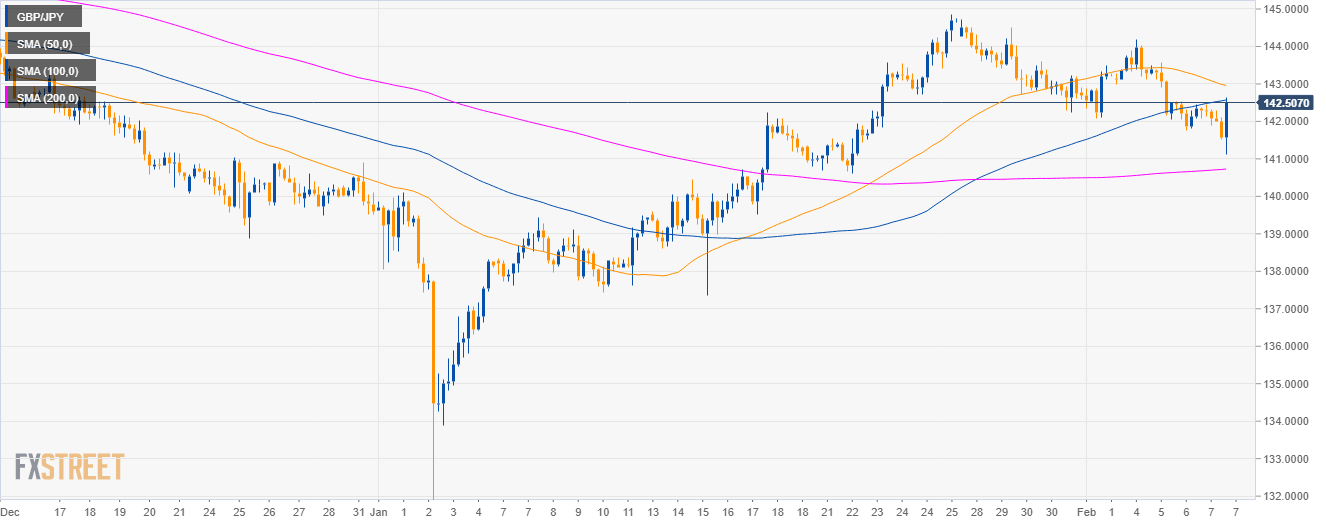
GBP/JPY 4-hour chart
- GBP/JPY is trading between the 100 and 200 SMA on the 4-hour chart suggesting a sideways market in the medium-term.
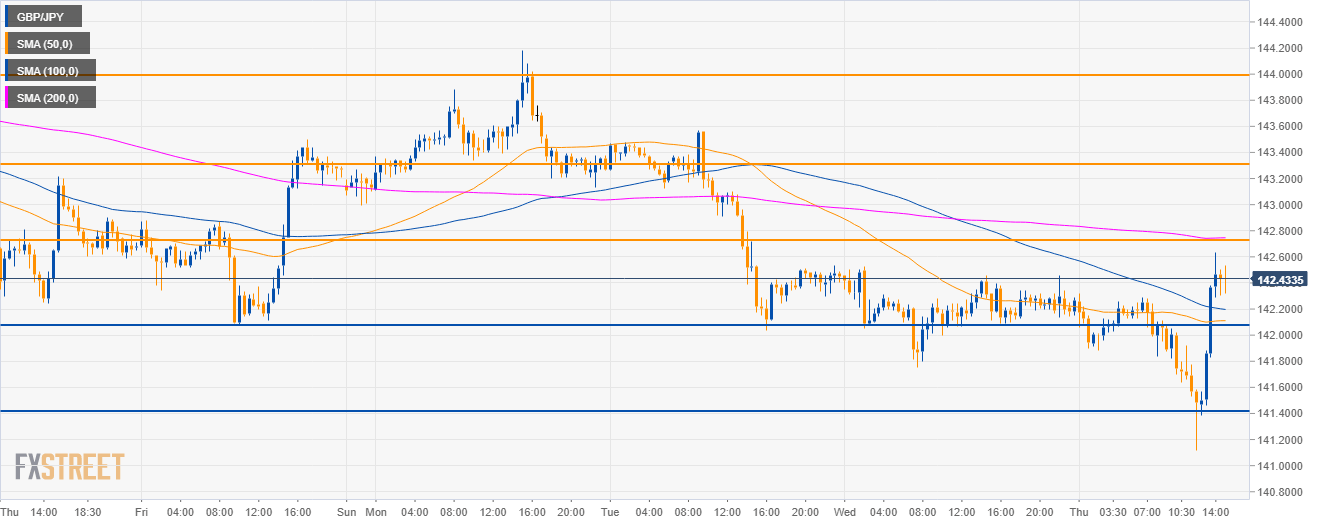
GBP/JPY 30-minute chart
- Bulls broke above the 142.00 figure and the 50 and 100 SMAs suggesting bullish momentum in the near-term.
- GBP/JPY needs a break of 142.70 to target 143.30 and 144.00 figure to the upside.
- On the way down, investors can expect support at 142.10 and 141.40 level.
Additional key levels
GBP/JPY
Overview:
Today Last Price: 142.46
Today Daily change: 23 pips
Today Daily change %: 0.16%
Today Daily Open: 142.23
Trends:
Daily SMA20: 141.93
Daily SMA50: 141.56
Daily SMA100: 144.17
Daily SMA200: 144.97
Levels:
Previous Daily High: 142.53
Previous Daily Low: 141.75
Previous Weekly High: 144.73
Previous Weekly Low: 142.08
Previous Monthly High: 144.85
Previous Monthly Low: 131.79
Daily Fibonacci 38.2%: 142.05
Daily Fibonacci 61.8%: 142.23
Daily Pivot Point S1: 141.81
Daily Pivot Point S2: 141.39
Daily Pivot Point S3: 141.03
Daily Pivot Point R1: 142.59
Daily Pivot Point R2: 142.95
Daily Pivot Point R3: 143.37
