- The GBP/JPY hourly chart shows the relative strength index (RSI) is not confirming lower lows on price chart (bullish divergence).
- The pair could revisit the descending bearish 50-hour MA, currently seen at 146.50, if the current or the next hourly candle confirms the positive RSI divergence by closing in green.
Hourly chart
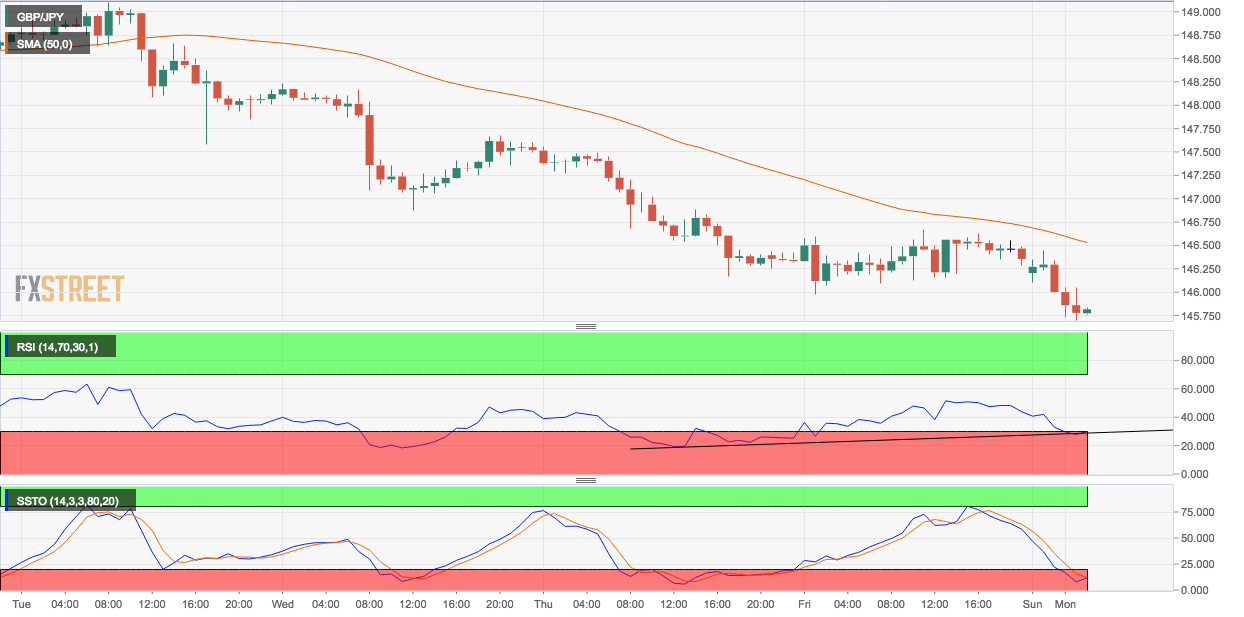
Spot Rate: 145.80
Daily High: 146.42
Daily Low: 145.70
Trend: Intraday bullish
Resistance
R1: 145.97 (resistance as per the hourly chart)
R2: 146.52 (50-hour moving average)
R3: 146.87 (July 18 low resistance on the hourly chart)
Support
S1: 144.99 (March 2 low)
S2: 143.77 (June 28 low)
S3: 143.20 (May 29 low)
