- GBP/JPY stays positive after bouncing off 139.00.
- A three-day-old falling resistance line limits the immediate upside.
- The downside break of 200-HMA highlights 61.8% Fibonacci retracement as the next key support.
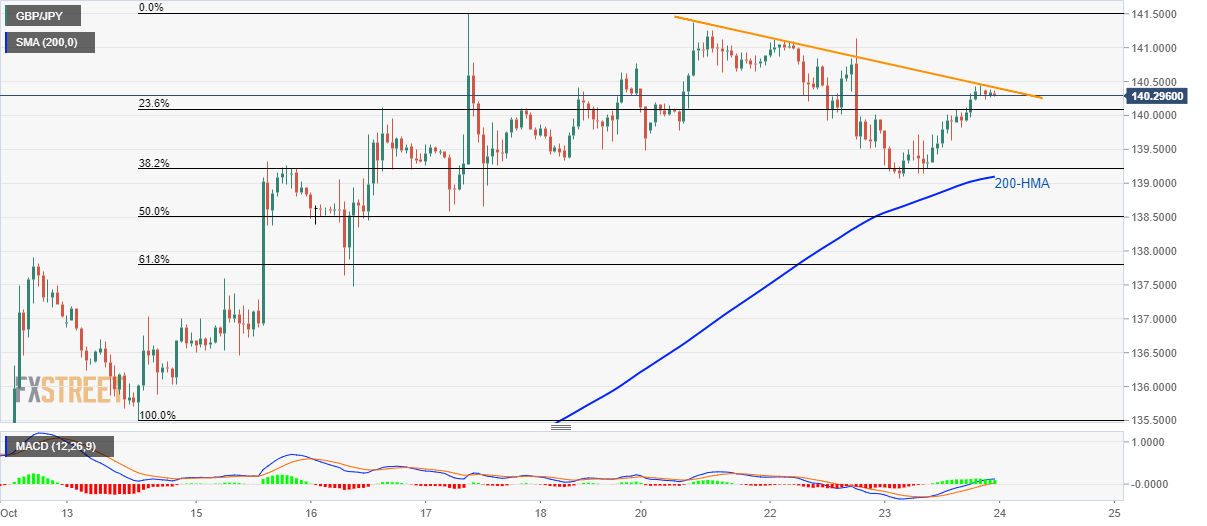
Despite bouncing off 139.00, a short-term resistance line questions the GBP/JPY pair’s immediate upside as it trades near 140.30 during early Thursday.
The pair needs to cross 140.45 resistance line in order to challenge monthly top surrounding 141.50.
During pair’s sustained upside beyond 141.50, late-May high nearing 141.75 holds the key to rise towards April low near 143.75.
Meanwhile, a 200-Hour Simple Moving Average (HMA) level of 139.10 acts as the key support, a break of which could fetch the quote to 50% and 61.8% Fibonacci retracements of October 14-17 rise, respectively around 138.50 and 137.80.
Should there be additional weakness past-137.80, 136.50 and 136.00 will be on the bear’s radar.
GBP/JPY hourly chart
Trend: pullback expected
