- GBP/JPY is challenging the 135.66 multi-week high.
- The next resistance to the upside can be near the 137.80 swing high.
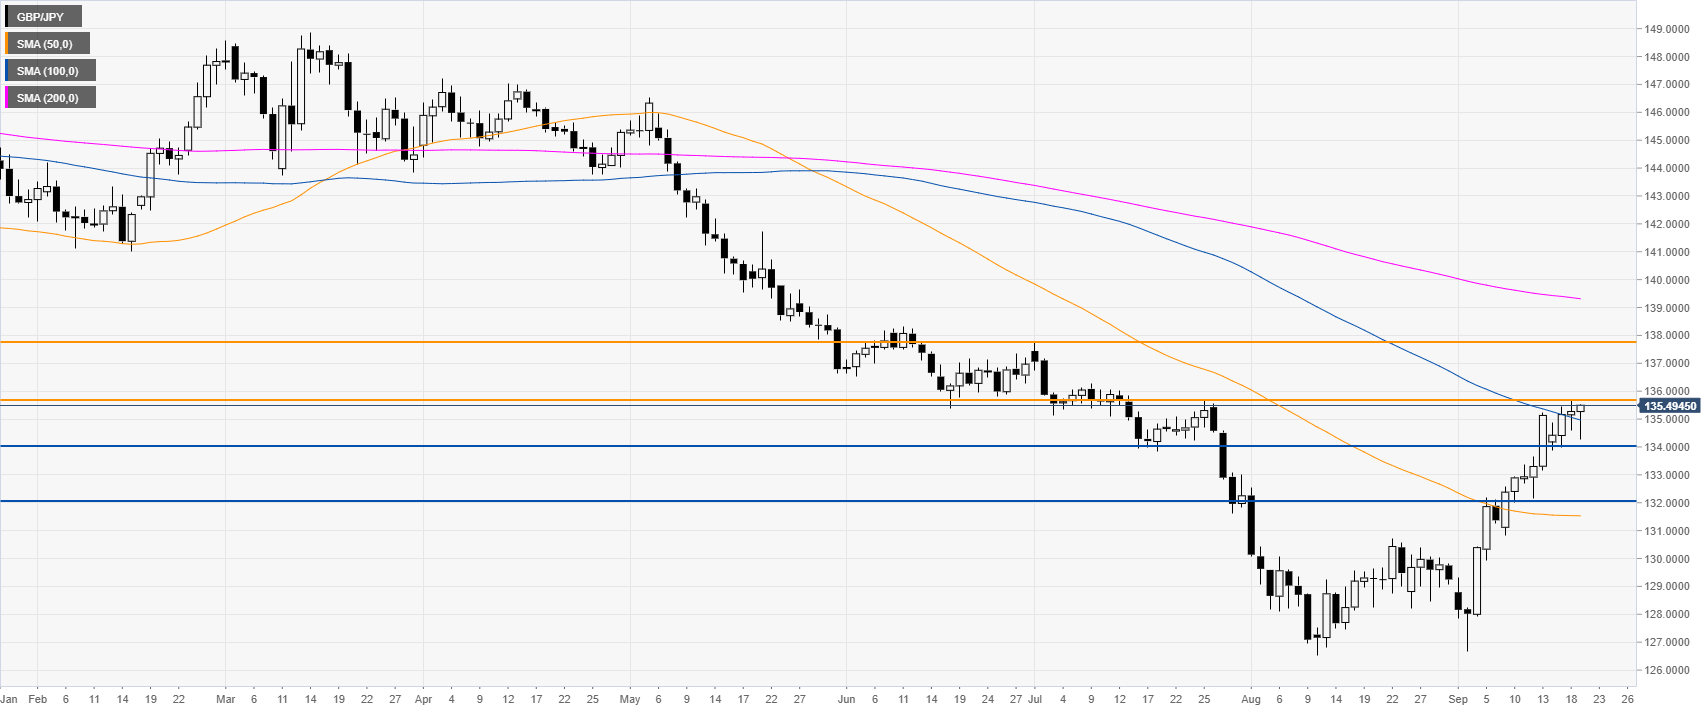
GBP/JPY daily chart
GBB/JPY has been rebounding sharply in September. The market is now challenging the 135.66 swing high above the 100 SMA. A break above that level can open the doors to further gains towards the 137.80 level at the July highs.
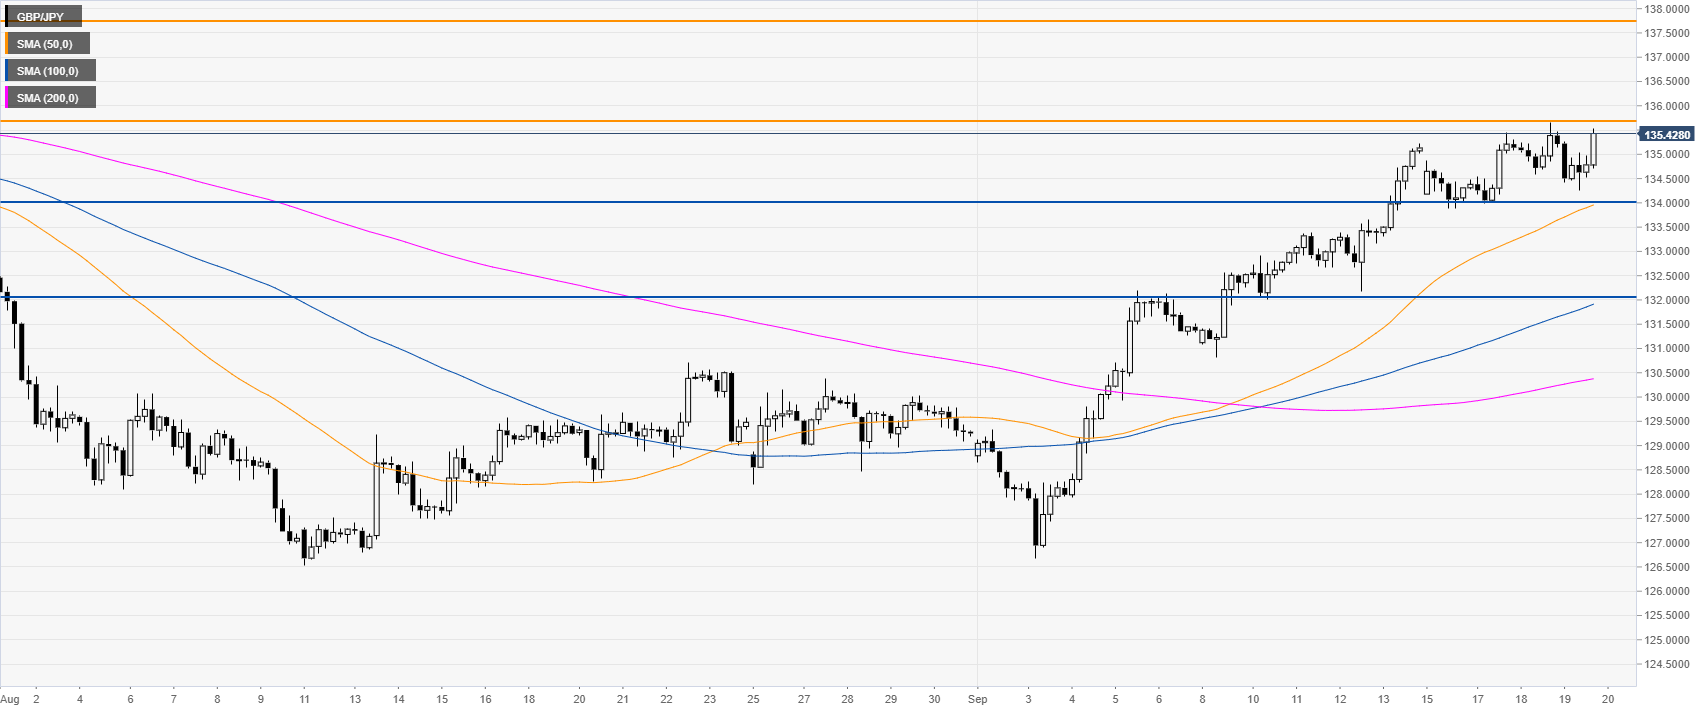
GBP/JPY four-hour chart
GBP/JPY is trading above its main SMAs on the four-hour chart, suggesting bullish momentum. Support can be seen at the 134.00 and 132.00 price levels.
Additional key levels
