- GBP/JPY bounces off the short-term triangle support.
- An upside break of the formation can recall October highs while 137.50 could lure sellers below pattern’s support.
Following its one-month-old trading formation, GBP/JPY recovers to 139.80 by the press time of Friday’s Asian session.
The symmetrical triangle formation keeps prices under check between 139.50/45 and 140.35.
Pair’s recent pullback could push the quote towards pattern’s resistance, at 140.35 now, a break of which is likely a trigger for the fresh run-up to October high of 141.51. However, late-May high near 141.75 could question the pair’s further rise.
On the downside break of 139.45, October 16 low near 137.50 and 137.00 could stop sellers from targeting the September month top nearing 135.75.
GBP/JPY 4-hour chart
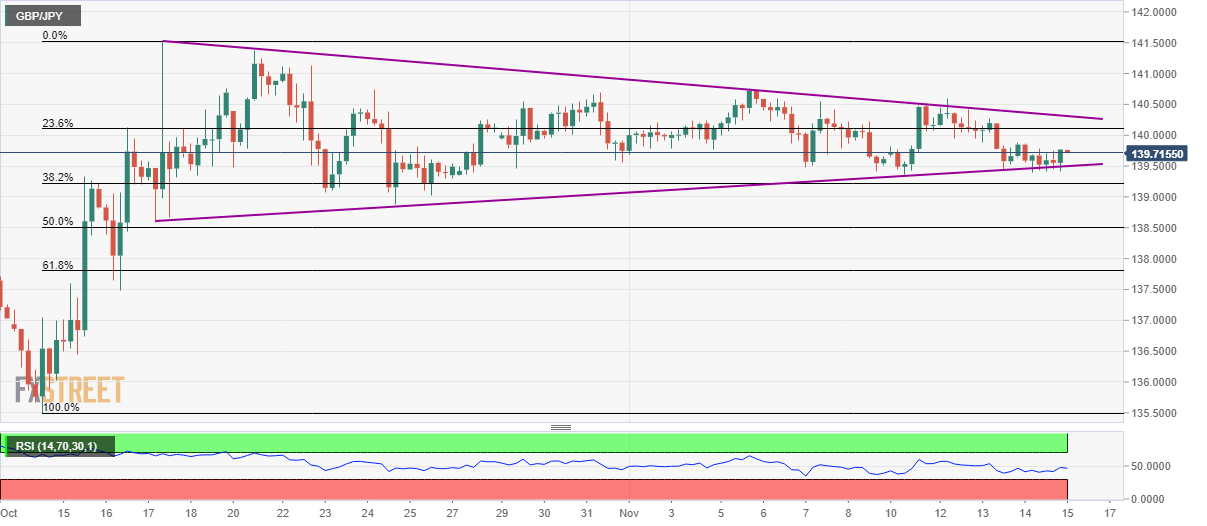
Trend: Sideways
