“¢ The cross seems to be forming a bearish Head & Shoulders chart pattern on the 1-hourly chart, with neckline support near the 144.75 region.
“¢ The fact that any up-move beyond 200-hour SMA is being sold into adds credence to increasing selling interest at higher levels.
“¢ Short-term technical indicators have struggled to move back in positive territory and further reinforce the bearish chart pattern formation.
“¢ A sustained move beyond mid-146.00s would now be needed to negate prospects for any further near-term downside.
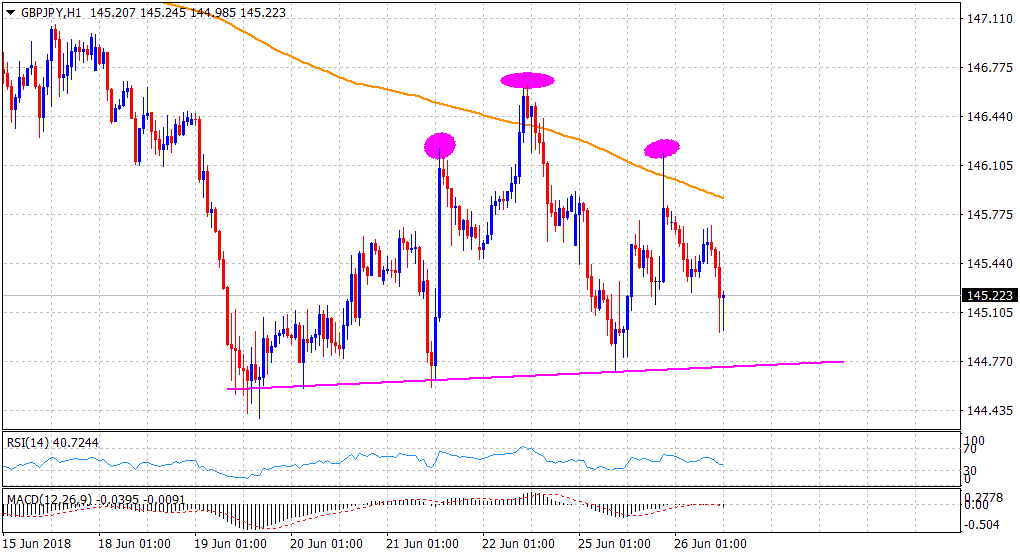
Current Price: 145.22
Daily High: 145.80
Daily Low: 144.97
Trend: Turning Bearish
Resistance
R1: 145.55 (daily pivot-point)
R2: 145.89 (200-period SMA H1)
R3: 146.19 (overnight swing high)
Support
S1: 144.97 (current day swing low)
S2: 144.75 (bearish H&S neckline)
S3: 144.06 (S2 daily pivot-point)
