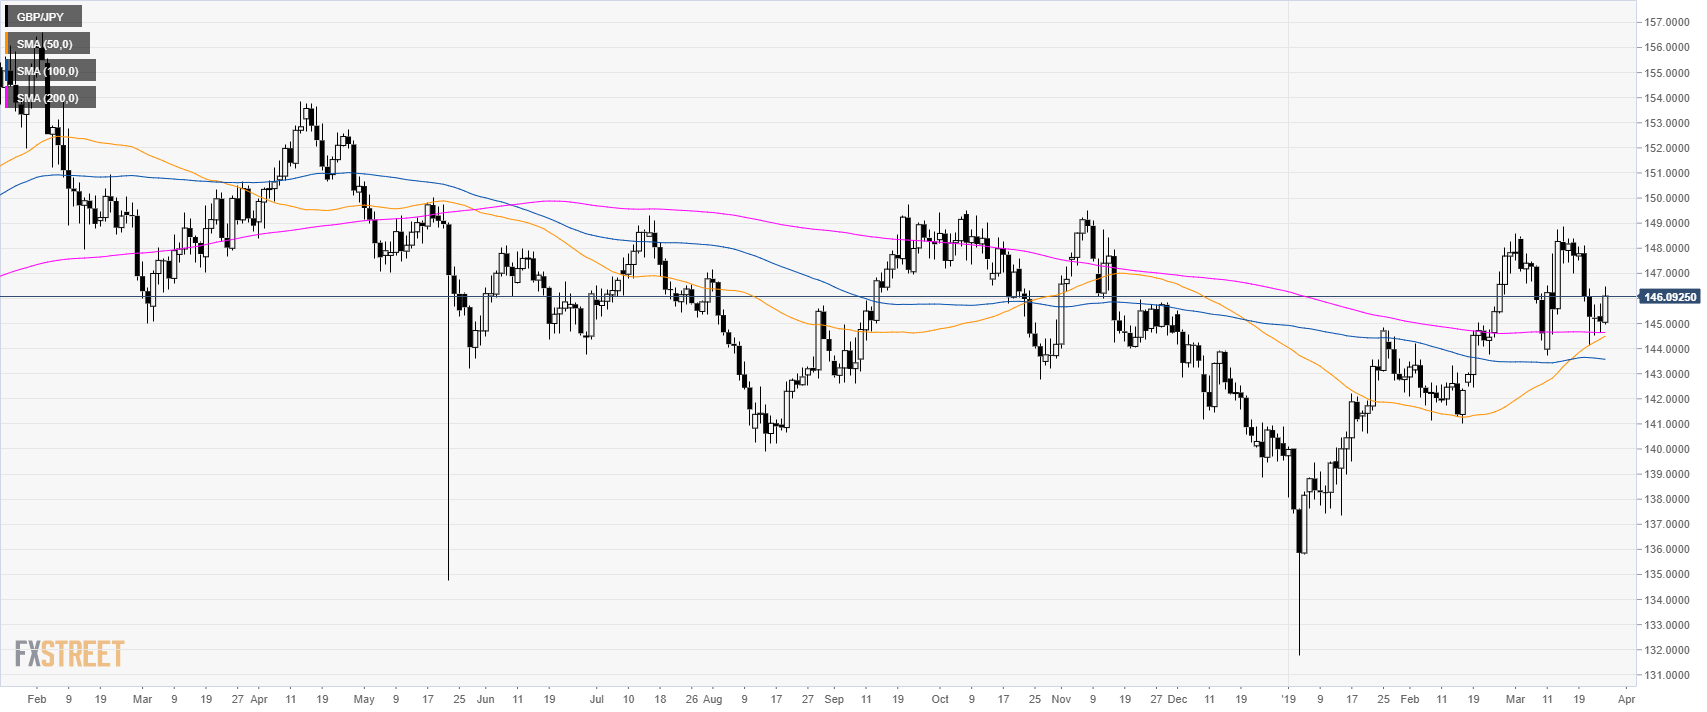
GBP/JPY daily chart
- GBP/JPY is trading in a bull trend above its main simple moving averages (SMAs).
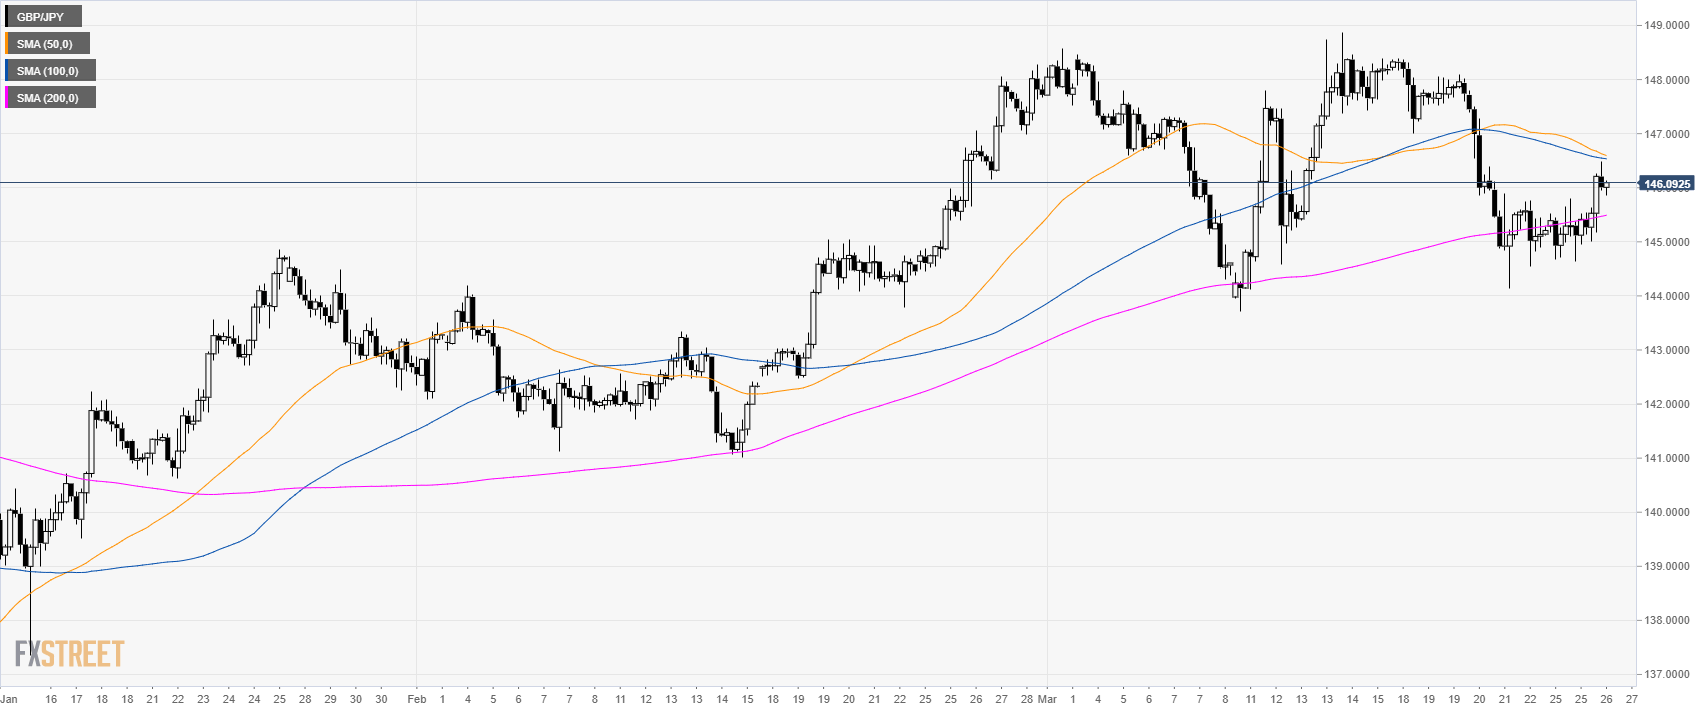
GBP/JPY 4-hour chart
- GBP/JPY is in a consolidation between the 100 and 200 SMAs.
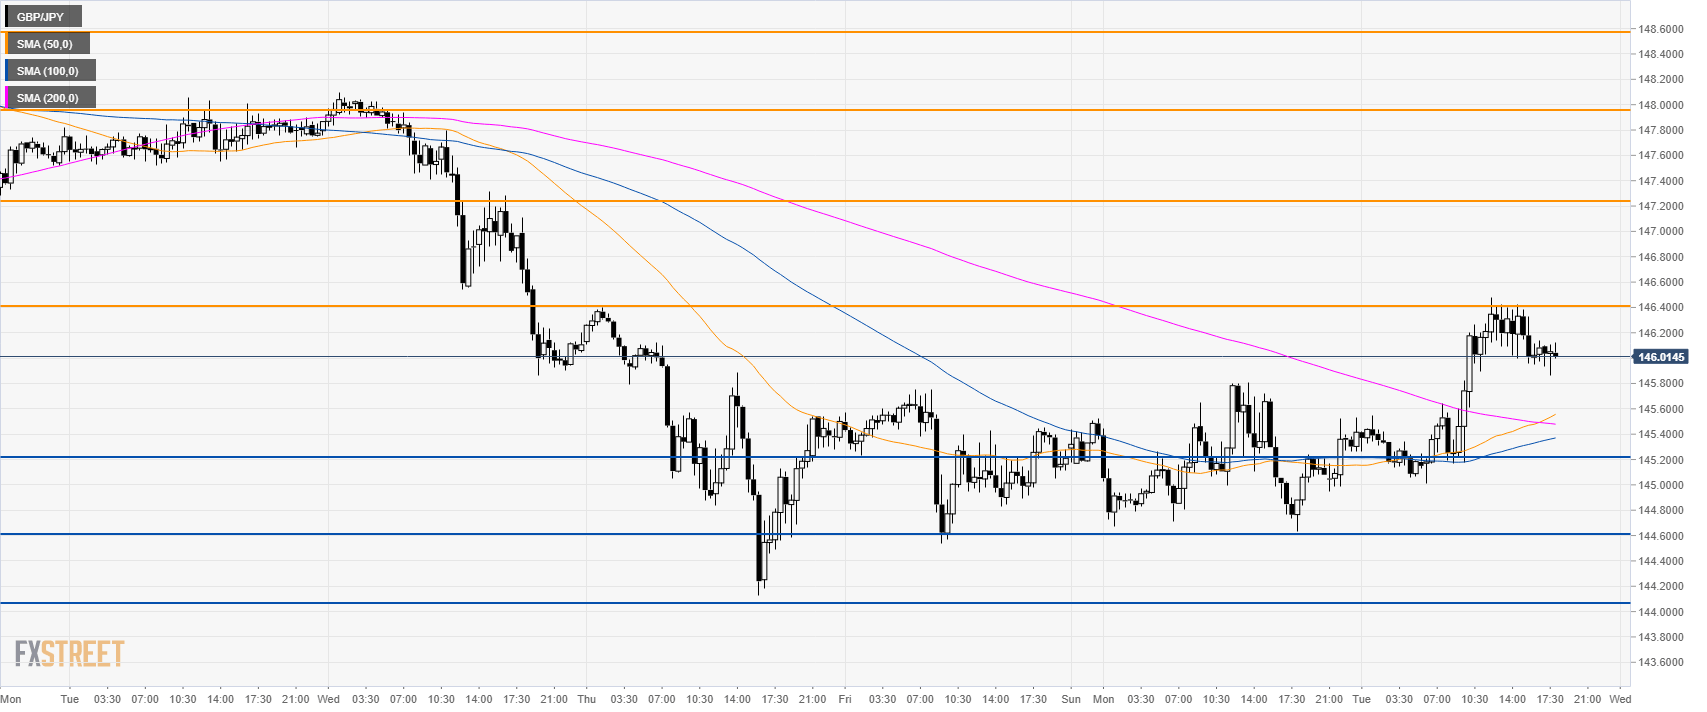
GBP/JPY 30-minute chart
- GBP/JPY is trading above its main SMAs suggesting a bullish bias in the short-term.
- A bullish break above 146.40 can lead to 147.20 and 148.00 resistances.
- To the downside, support is at 145.20 and 148.00 level.
Additional key levels
