- Successful recovery form 143.80/70 favors bulls.
- 200-day SMA and nearby trend-line can flash on buyers’ radar.
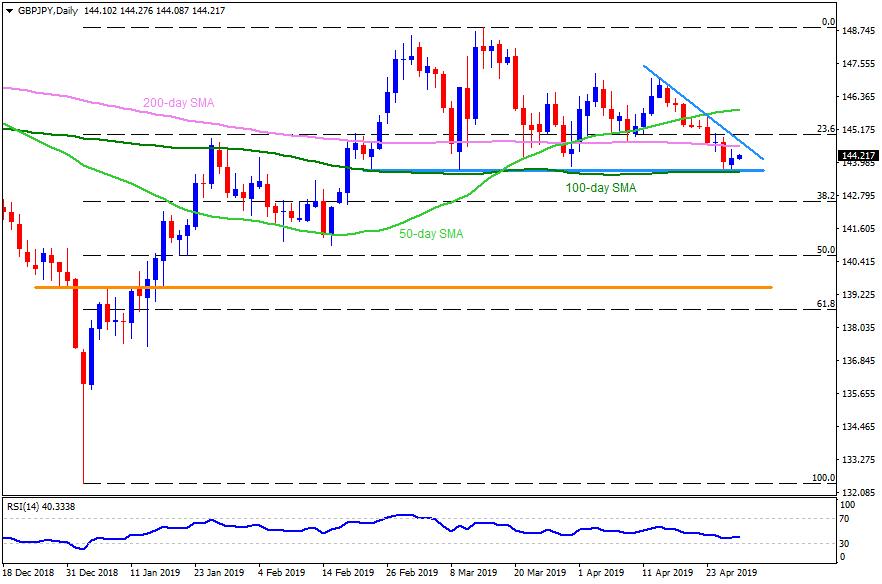
GBP/JPY is taking the bids around 144.20 during initial Asian sessions on Monday. The quote recently bounced off 143.80/70 support-zone comprising lows marked since late-February and 100-day simple moving average (SMA), which in turn signal brighter chances of its run-up to challenge 200-day SMA.
If buyers manage to surpass 200-day SMA level of 144.60, short-term descending trend-line at 144.80, followed by 145.20, can act as intermediate halts during the upside towards 50-day SMA level of 145.90.
Additionally, pair’s sustained rise beyond 145.90 enables it to question current month high near 147.20.
On the downside break of 143.70, 143.00 and February month low near 141.00 could gain sellers’ attention.
Assuming the bear’s dominance past-141.00, 140.00 and a horizontal-line joining lows of December 28 and January 17 surrounding 139.40 could appear on the chart.
GBP/JPY daily chart
Trend: Positive
