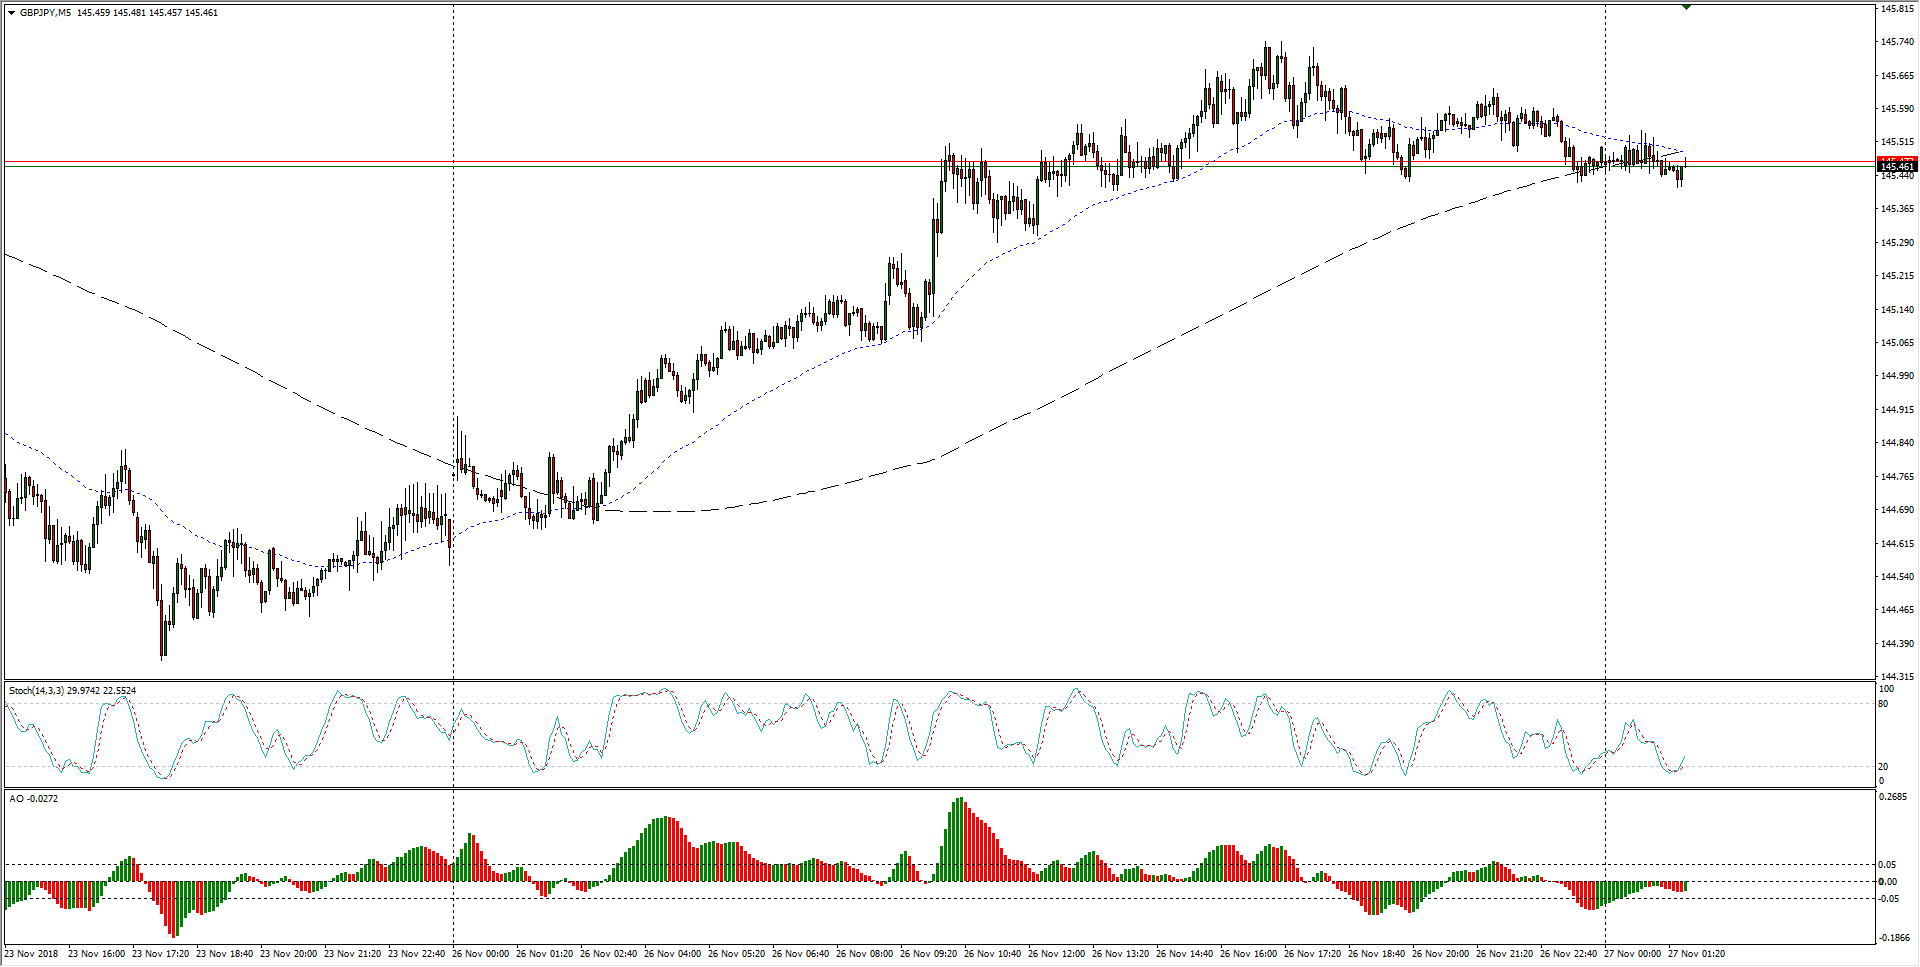
- The GBP/JPY saw a soft rise over the past twenty-four hours, lifting from the week’s open near 144.75 to a near-term high of 145.75.
- The near-term bounce is likely owing to a softening of the JPY, and risk-on/off flows could see a firm hand on market direction this week.
GBP/JPY Chart, 5-Minute
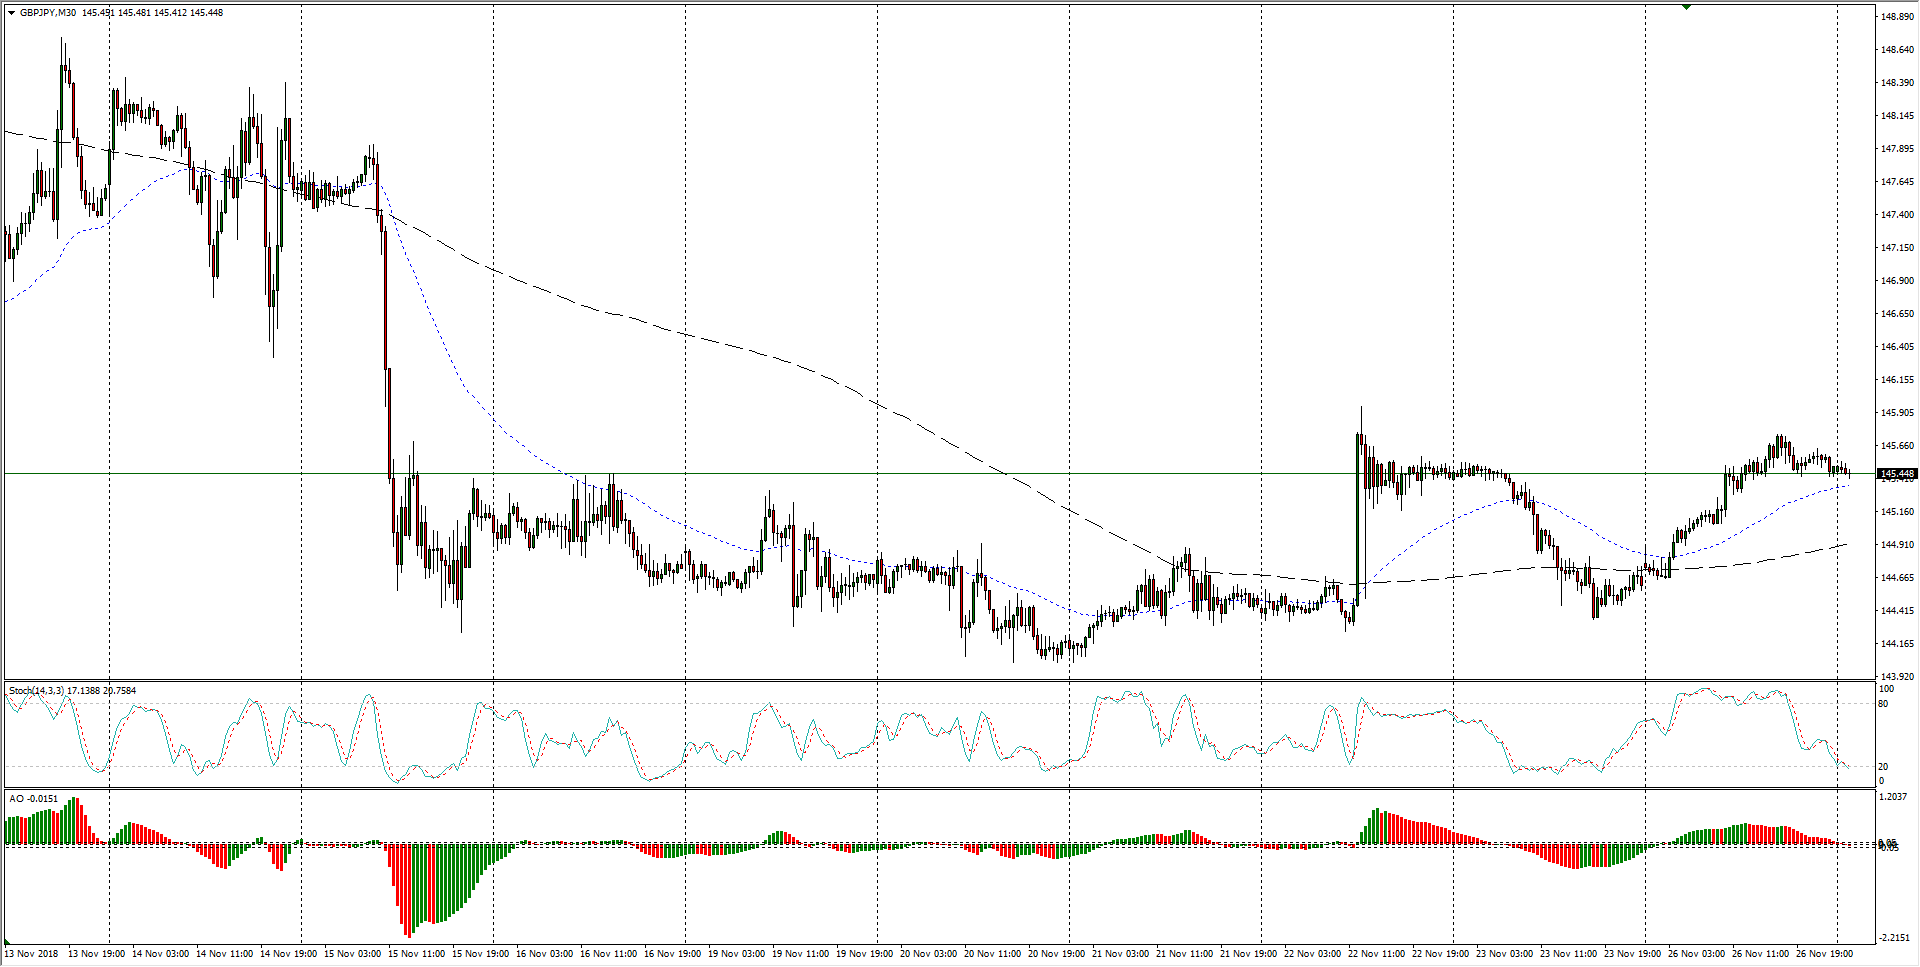
- The past two weeks have seen the Guppy struggle to regain a bullish poise after risk-off took the pair down from highs just below the major 150.00 handle, but bidders have managed to halt declines and price in a floor from the 144.00 level.
GBP/JPY Chart, 30-Minute
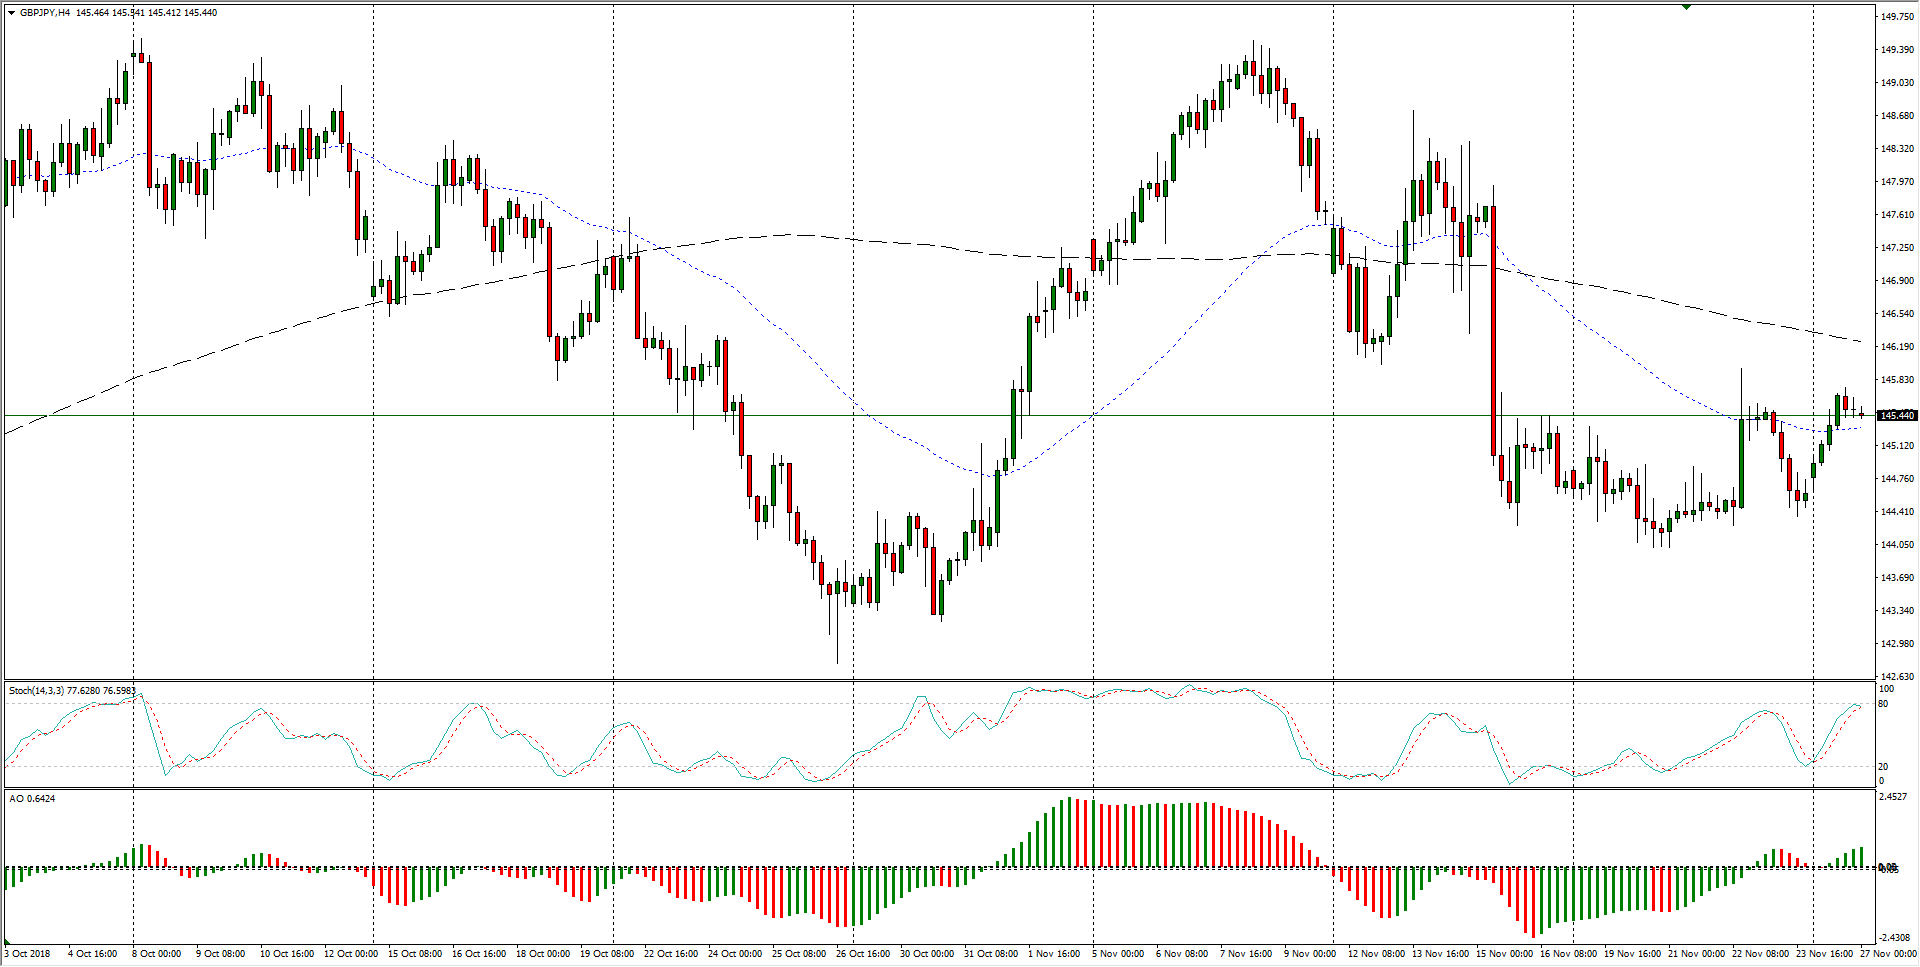
- The GBP/JPY continues to cycle in a rough range through the medium-term, constrained by a ceiling from the 148.00-150.00 region while stuck on softly-rising lows from 144.50, highlighting the Guppy’s exposure to broad-market risk flows.
GBP/JPY Chart, 4-Hour
GBP/JPY
Overview:
Today Last Price: 145.46
Today Daily change: 76 pips
Today Daily change %: 0.525%
Today Daily Open: 144.7
Trends:
Previous Daily SMA20: 146.07
Previous Daily SMA50: 146.91
Previous Daily SMA100: 145.78
Previous Daily SMA200: 147.07
Levels:
Previous Daily High: 145.56
Previous Daily Low: 144.35
Previous Weekly High: 145.96
Previous Weekly Low: 144.01
Previous Monthly High: 149.52
Previous Monthly Low: 142.78
Previous Daily Fibonacci 38.2%: 144.81
Previous Daily Fibonacci 61.8%: 145.1
Previous Daily Pivot Point S1: 144.18
Previous Daily Pivot Point S2: 143.66
Previous Daily Pivot Point S3: 142.97
Previous Daily Pivot Point R1: 145.39
Previous Daily Pivot Point R2: 146.08
Previous Daily Pivot Point R3: 146.6
