GBP/USD is taking a break from the big downfall that it suffered after UK PM Theresa May decided to postpone the vote on the Brexit deal. What’s next? The higher volatility implies a broader range of movement.
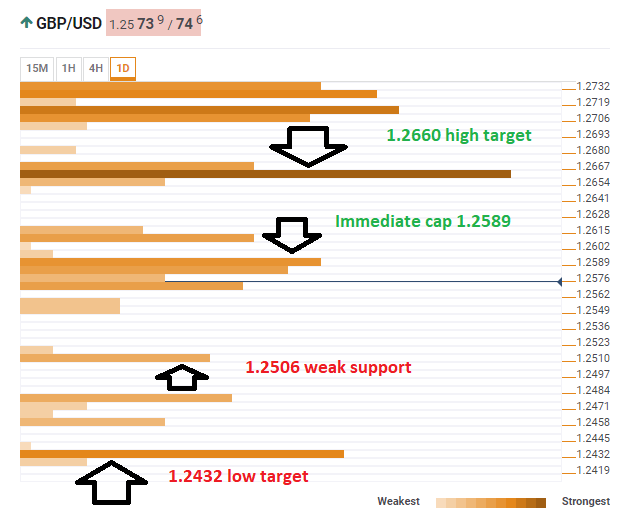
The Technical Confluences Indicator shows that cable is capped by uptrend resistance at around 1.2589 where we see the convergence of the Pivot Point one-month Support 1, the Simple Moving Average 5-4h, the Bollinger Band 1h-Middle, and the BB 15m-Upper.
The next cap is significantly higher, at 1.2660 where we see the confluence of the Fibonacci 61.8% one-day, the Pivot Point one-month Support 1, the SMA 10-4h, and last week’s low.
Looking down, the pair has some weak support at around 1.2506which was yesterday’s low.
There are several additional lines of support down the road but the most considerable one is only at 1.2432 where we find the Pivot Point one-month Support 2.
This is how it looks on the tool:
Confluence Detector
The Confluence Detector finds exciting opportunities using Technical Confluences. The TC is a tool to locate and point out those price levels where there is a congestion of indicators, moving averages, Fibonacci levels, Pivot Points, etc. Knowing where these congestion points are located is very useful for the trader, and can be used as a basis for different strategies.
This tool assigns a certain amount of “weight” to each indicator, and this “weight” can influence adjacents price levels. This means that one price level without any indicator or moving average but under the influence of two “strongly weighted” levels accumulate more resistance than their neighbors. In these cases, the tool signals resistance in apparently empty areas.
