GBP/USD dropped below 1.2800 in the wake of Tuesday’s European session, and it may be only the beginning, as support is weak.
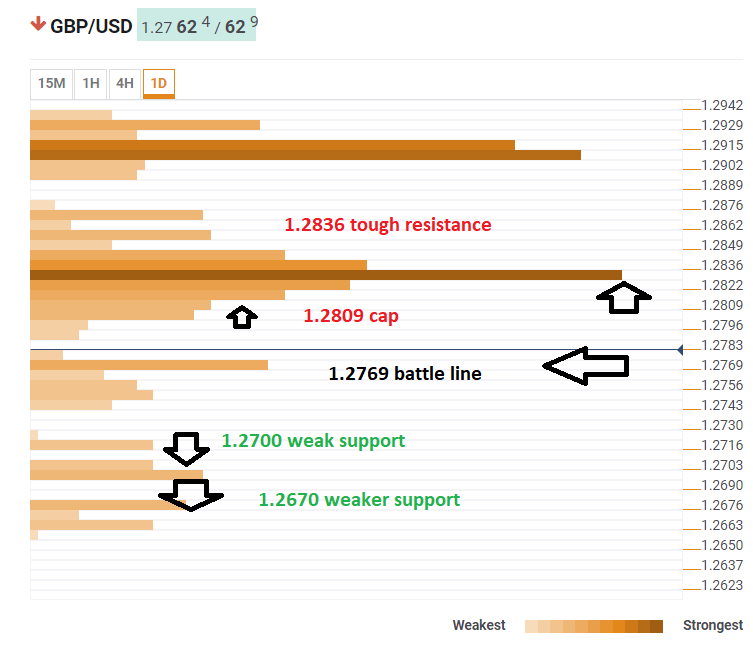
The Technical Confluences Indicator shows that cable is struggling with 1.2769, which is the convergence of last week’s low and the Bollinger Band 4h-Lower.
Further support is at 1.2700, and it is not that strong. It is the meeting point of the Pivot Point one-week Support 3 and last month’s low.
Lower, 1.2670 is the confluence of the Bollinger Band one-day Lower and the Pivot Point one-week Support 2.
Looking up, there is a lot of resistance which is more potent than the support lines such as 1.2809 which includes the Fibonacci 23.6% one-week, the SMA 10-15m, the SMA 5-1h, and the Bollinger Band 15m-Middle.
The peak is at 1.2836 with the dense cluster of the Simple Moving Average 100-15m, the SMA 50-1h, the SMA 1h, the SMA 5-4h, the SMA 5-4h, the Fibonacci 38.2% one-week, and the Fibonacci 23.6% one-month.
This is how it looks on the tool:
Confluence Detector
The Confluence Detector finds exciting opportunities using Technical Confluences. The TC is a tool to locate and point out those price levels where there is a congestion of indicators, moving averages, Fibonacci levels, Pivot Points, etc. Knowing where these congestion points are located is very useful for the trader, and can be used as a basis for different strategies.
This tool assigns a certain amount of “weight” to each indicator, and this “weight” can influence adjacents price levels. This means that one price level without any indicator or moving average but under the influence of two “strongly weighted” levels accumulate more resistance than their neighbors. In these cases, the tool signals resistance in apparently empty areas.
